Test your choices, before you put them into practice.


From € 85,000 revenue to € 43,738 take-home pay
Costs, tax, AOV (disability insurance), pension and buffer come off step by step.

Two numbers per hour
€ 43.74 per billable hour, or € 34.99 across all 1,250 hours you gave your business. The difference is in which hours you count.

Click through to the source
Zoom into your revenue and see what each client, each project and each income stream contributes.

From reading to course
Your reading is where you stand today: hours worked, money set aside, money spent. The Lab extends that line. What if the rest of the year goes like this, how much should I reserve, can I work less? At first the projection rests on the four values from your intake; every hour and every invoice makes it sharper.
How long can you hold out if work dries up?
Three scenarios side by side: your current course, a 40% drop in revenue and no income at all. The tax bill shows as a dip in your chart, on the day you pay it.
Your monthly position
What you keep each month for private life, after tax, buffer, business costs and provisions are set aside.
Zero income is your floor
The honest answer to "how long can I pay my bills if no work comes in?", in months of runway.
Your target in sight
How long it takes on your current course until your safety net covers six or twelve months.
Your hourly rate isn’t a straight line.
What happens to your net income if you raise your rate, or work less?
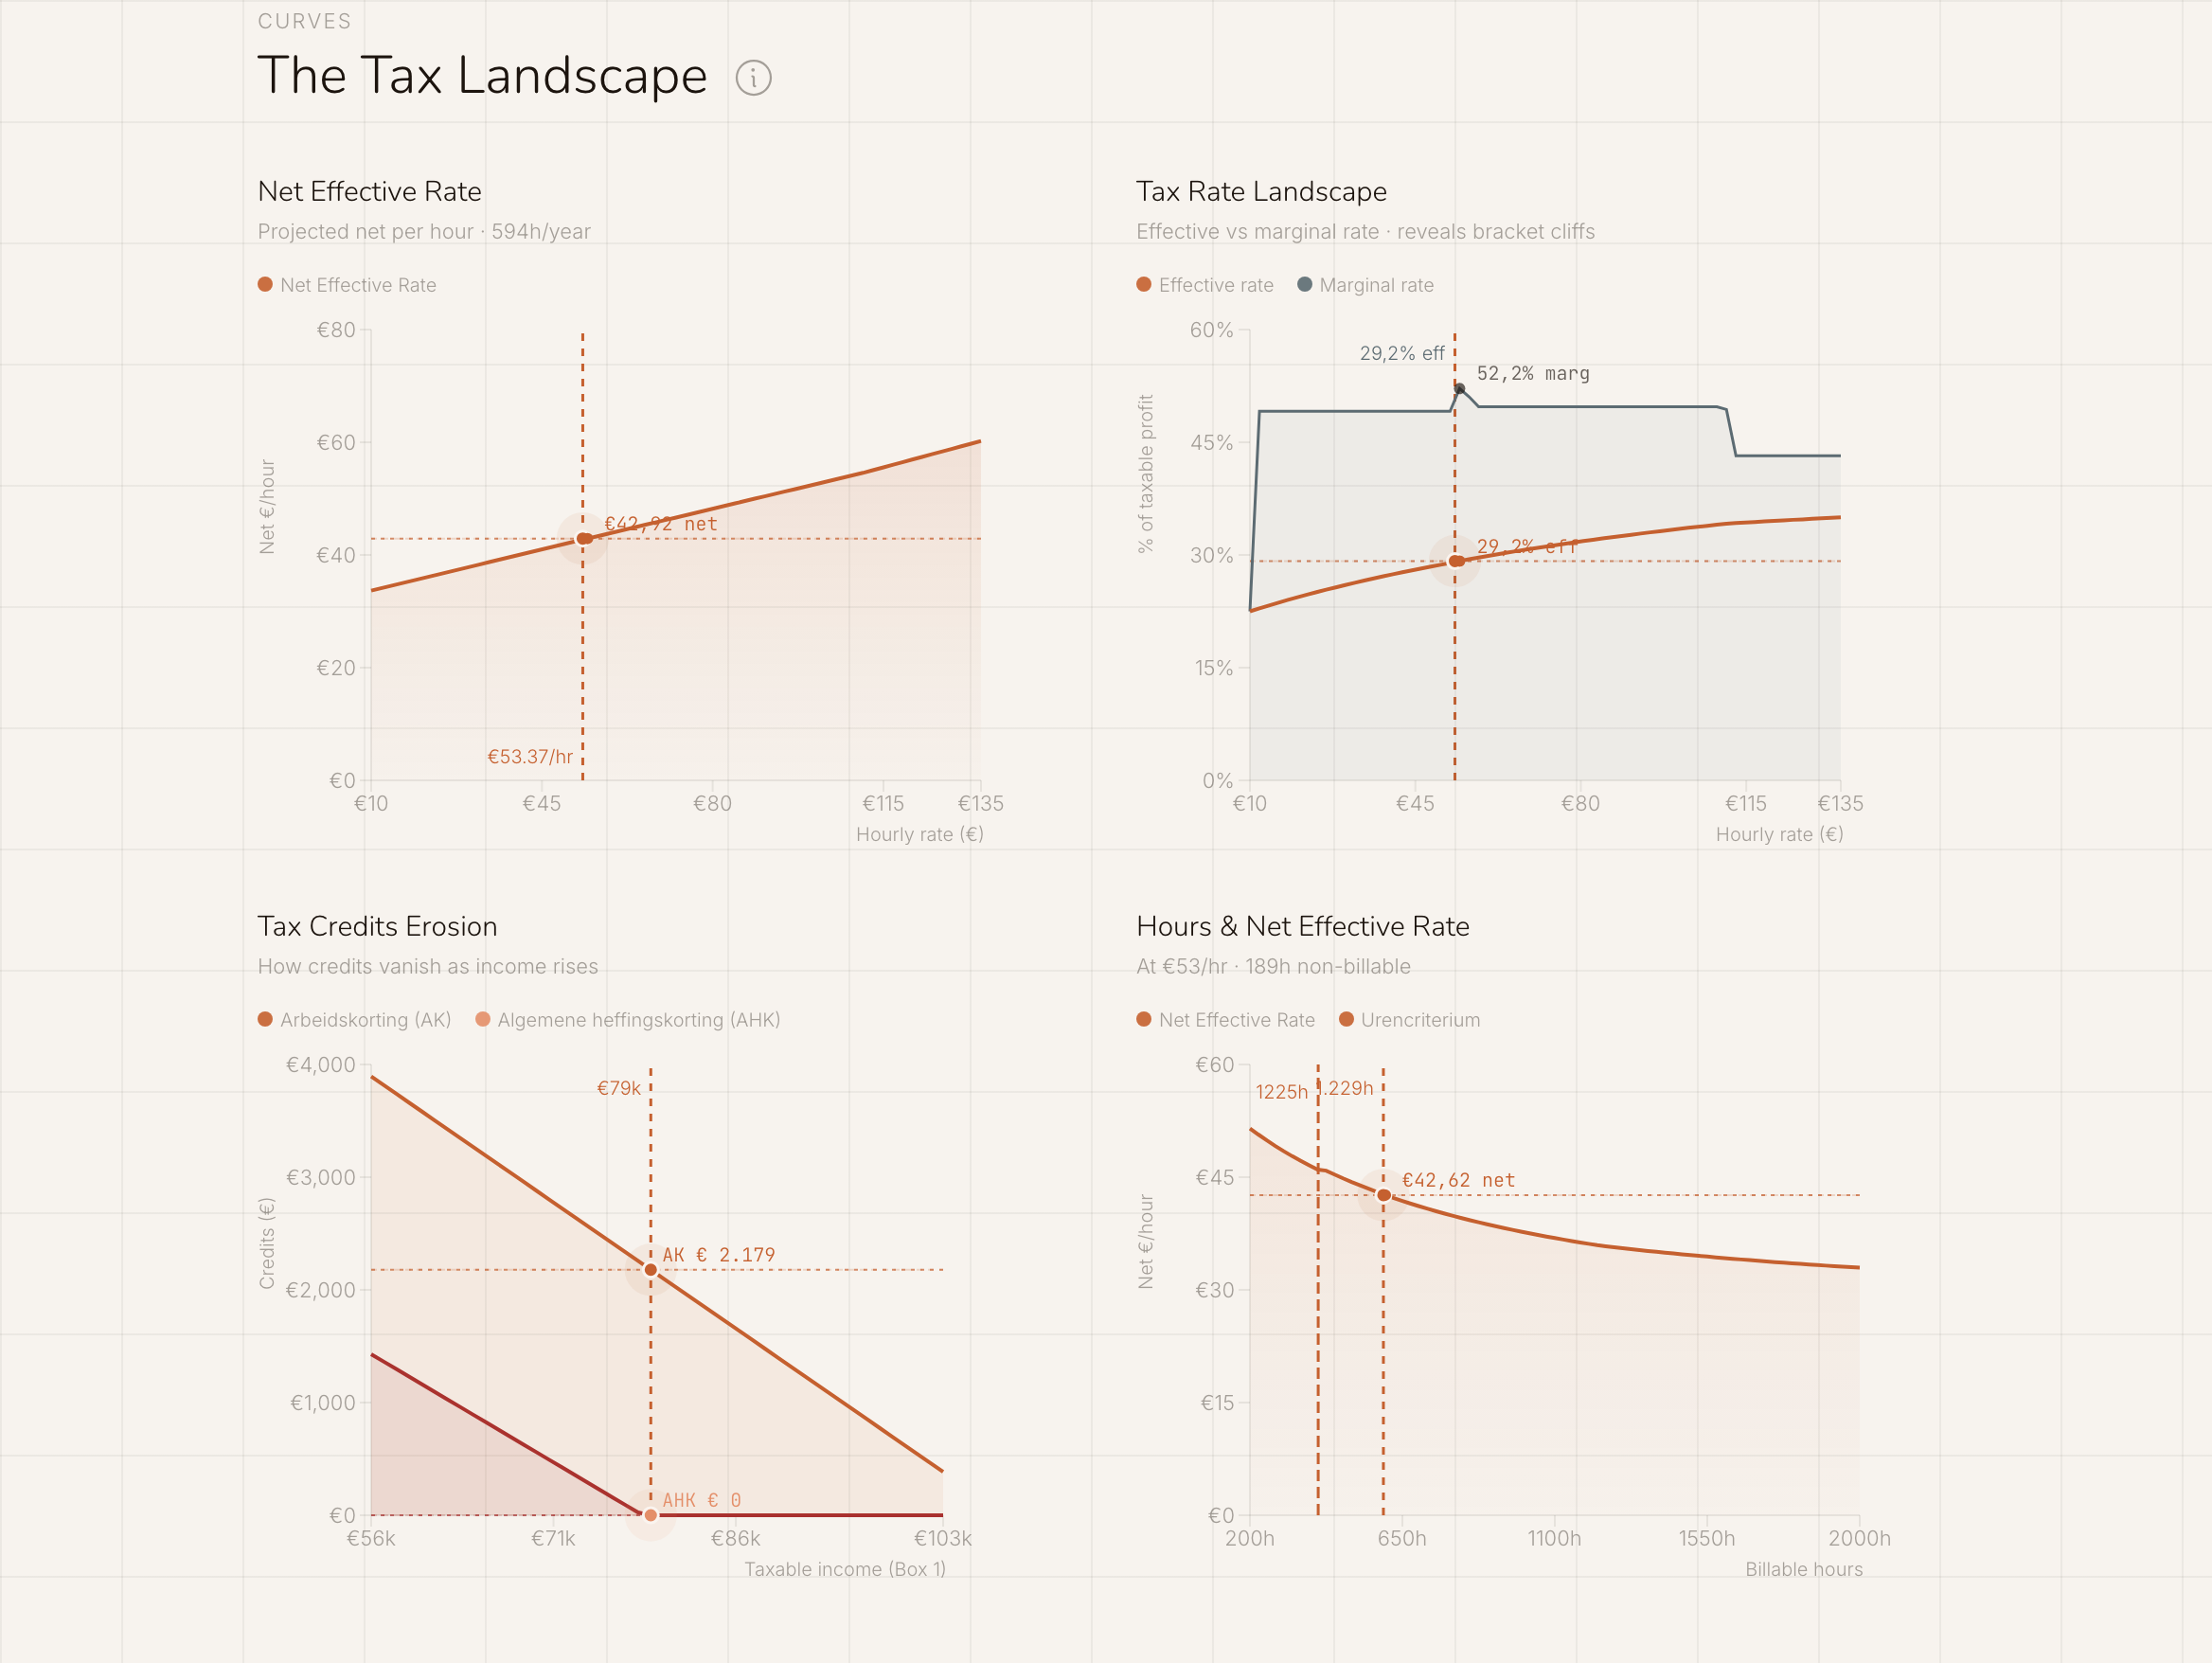
Rate versus net
The line bends where you enter a higher bracket. So you see where a raise still really pays.
Hours versus net
Which mix of hours and rate leaves you the same net amount?
Tax credits included
The phase-out of the Dutch labour and general tax credits (arbeidskorting, algemene heffingskorting) is in the line, not in a footnote.
Test a different course with your own numbers.
Raise your rate, drop a working day a week or put more into your pension, and see straight away what it does to your hourly rate, your safety net and your tax reservation. That way you test a choice before you make it.
Everything moves with it
Your waterfall, safety net, curves and employment comparison all recalculate in one go.
Reset in one click
A "Modified" label appears as soon as you change something; Reset puts everything back on your current course.
More detail when you need it
Retainer and project hours, deductible costs and your pension contribution are one click further.
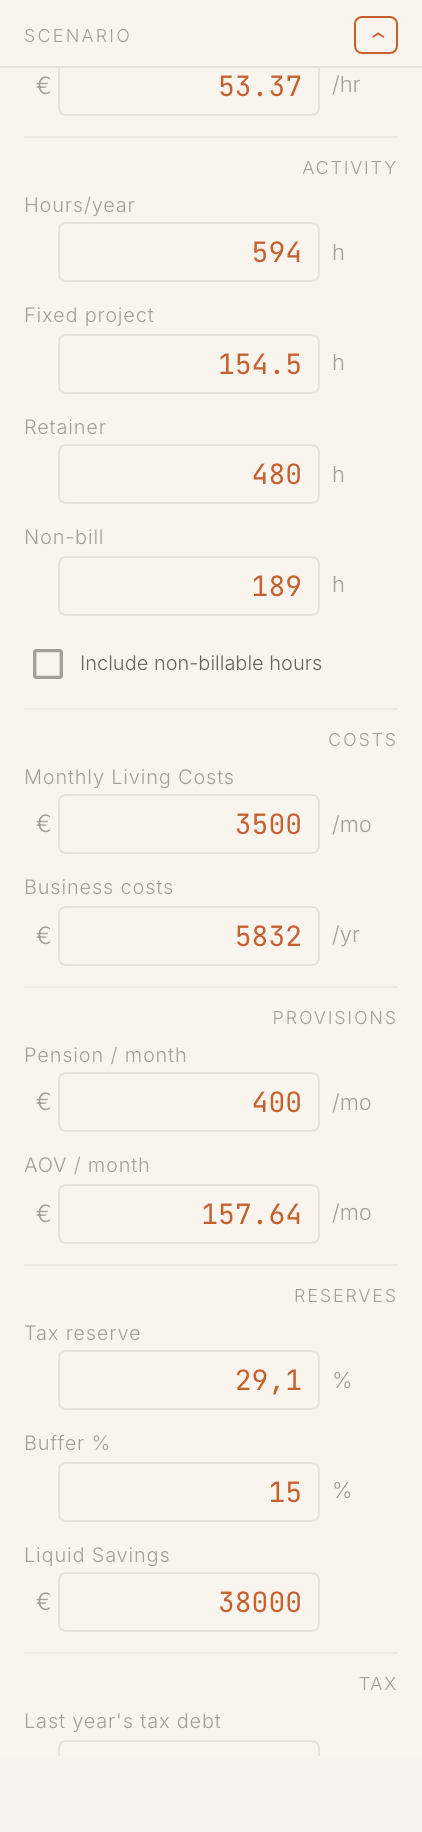
What would your work pay as an employee?
Peil works out which gross monthly salary gives you the same financial room, including pension, holiday pay and employer costs. It works the other way too: set a job offer against your current rate. Something to hold on to at decision moments, not a verdict.
What you arrange yourself
Paid leave, sick days and disability show as amounts beside your buffer.
A fair FTE comparison
Freelancing part-time? Then Peil compares with a part-time salary.
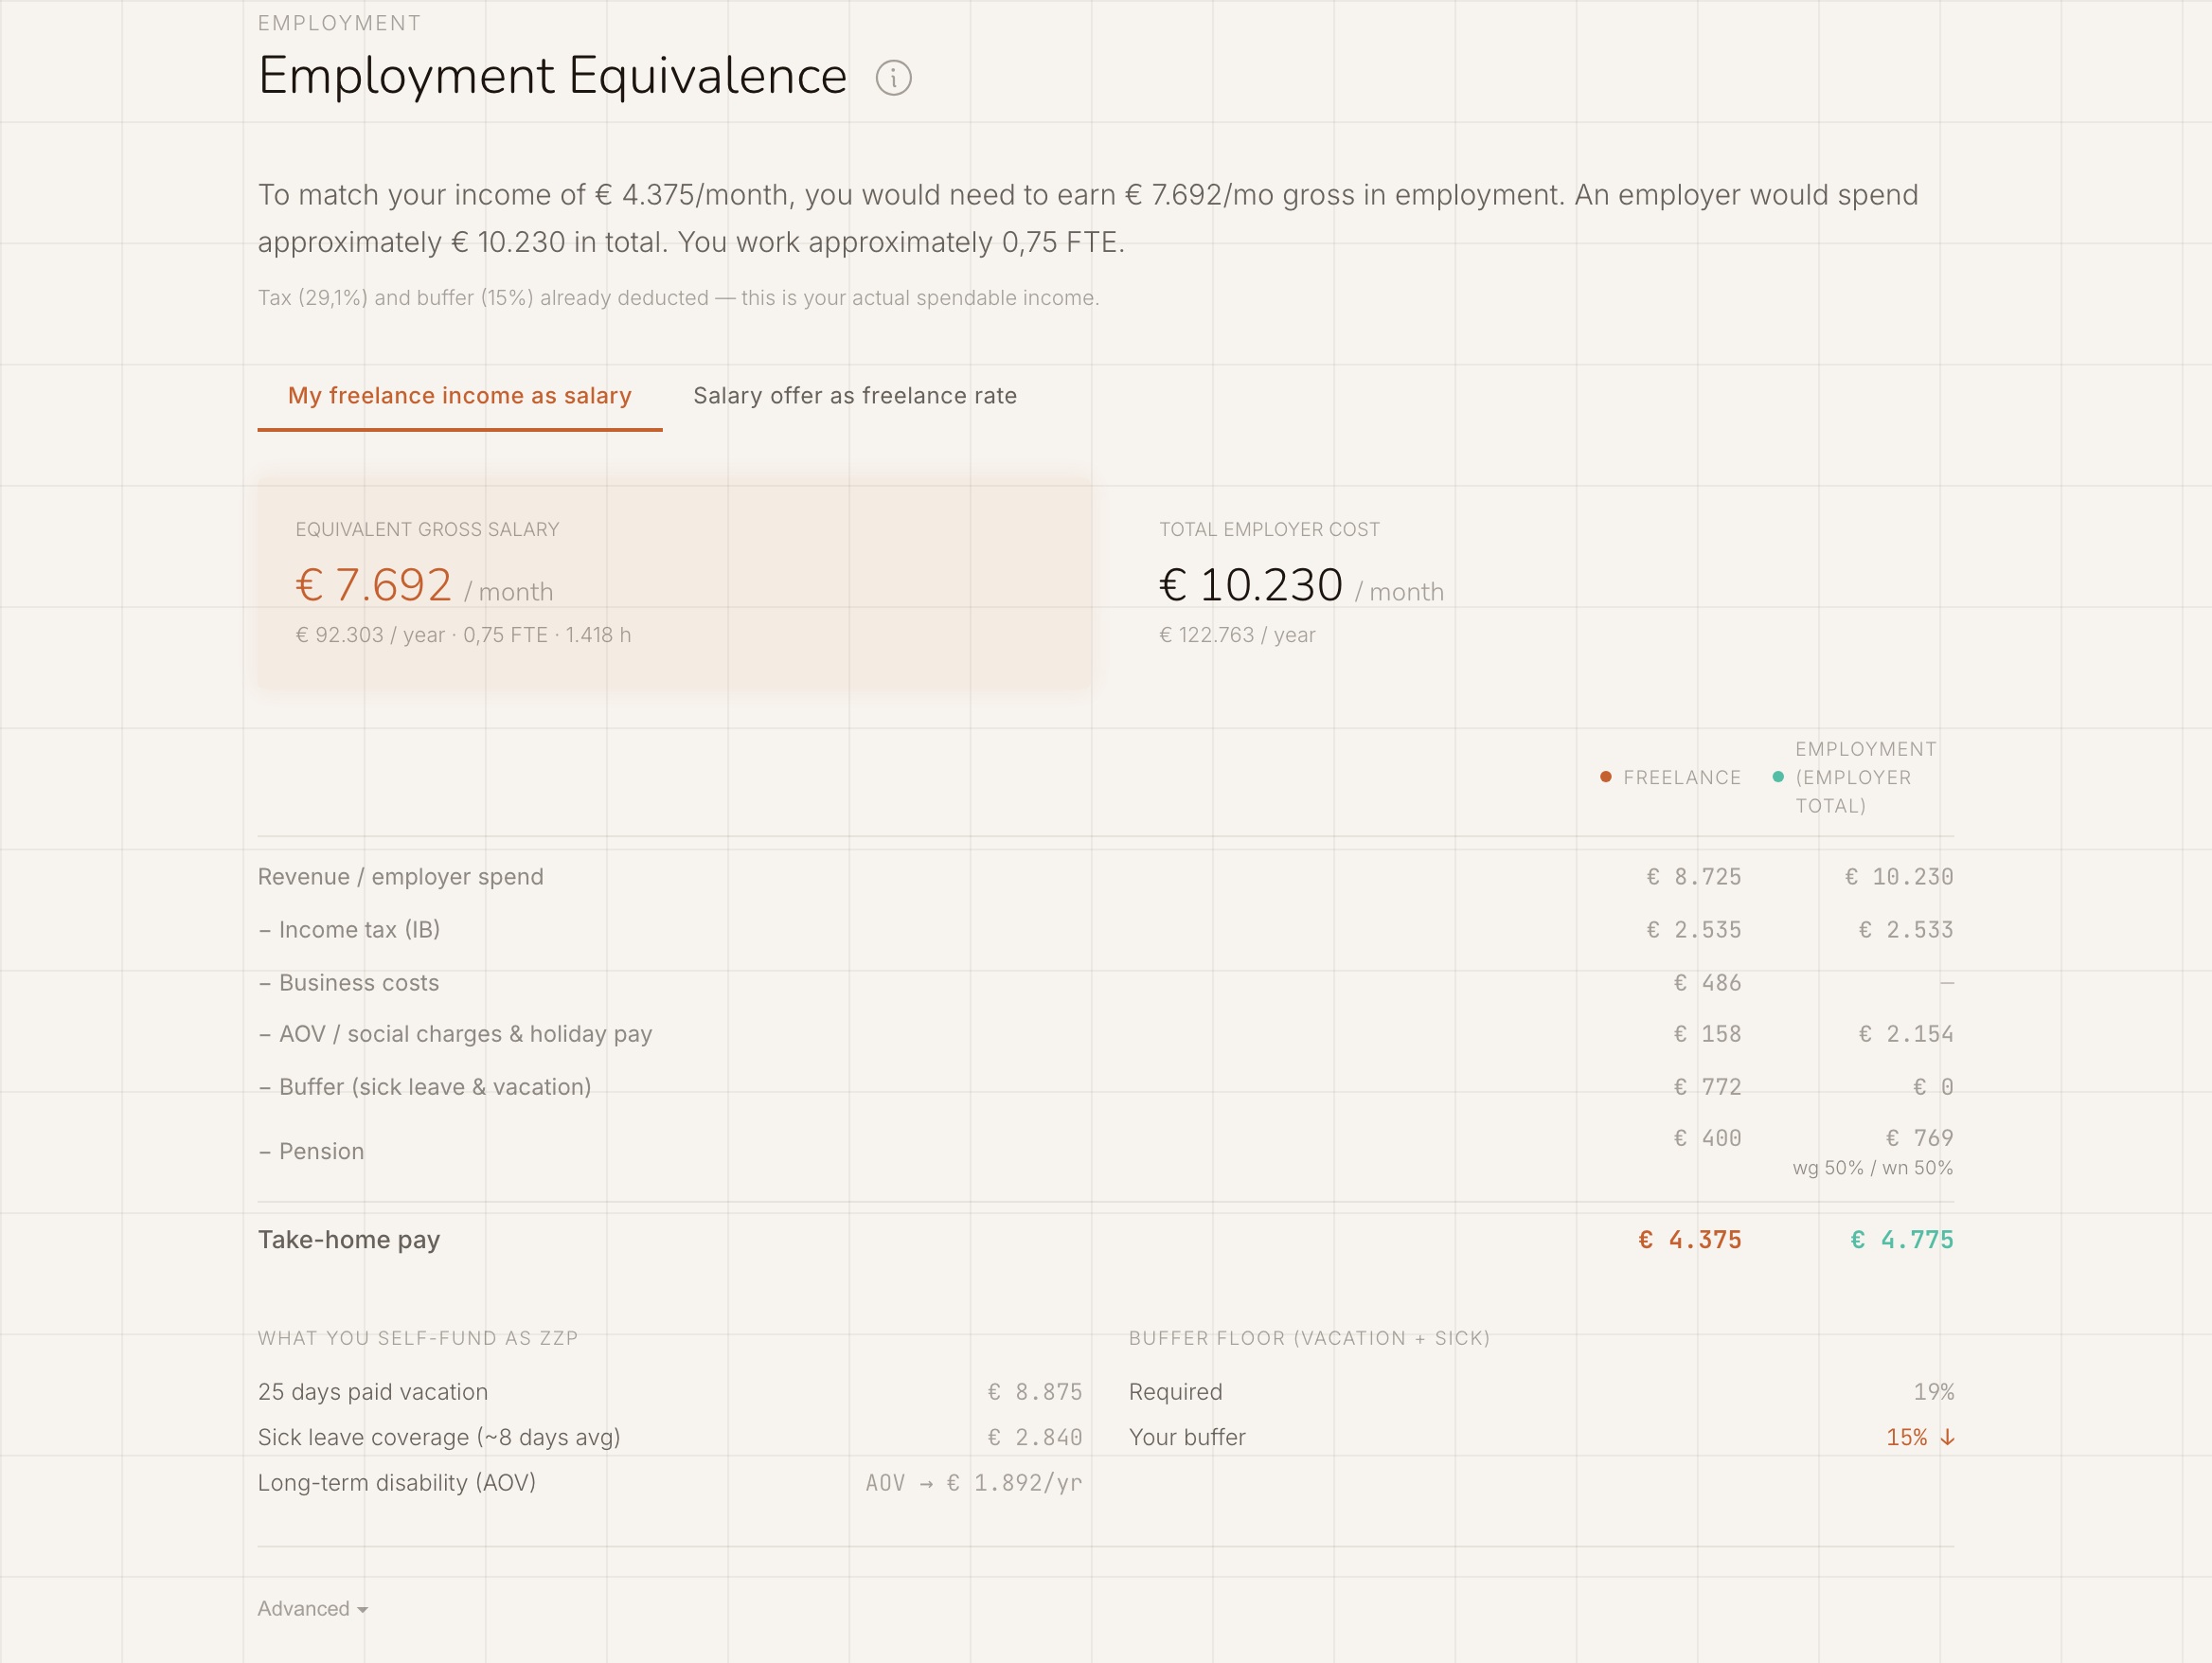

Free and Pro
The waterfall, the safety net, the curves and the employment comparison are free to view, on your own numbers. Moving your own assumptions in the scenario bar is part of Peil Pro.
From €85 invoiced to € 43.74 kept. See what you really keep.
Enter four values and your first scenario is there within a minute.
Does the Lab change my real numbers?
No. Whatever you change in the scenario bar lives only inside the Lab. Your hours, invoices and settings stay exactly as they are, and Reset takes you back to your actual numbers.
What is the difference between NER per billable hour and NER across all hours?
Both divide the same take-home pay, by a different number of hours. Per billable hour counts only the hours you invoice. Across all hours also counts the time you spend on acquisition, admin and proposals. That second number is stricter, and gives the most honest picture of what you really earn.
Where do the tax figures come from?
Straight from the current year’s Dutch parameters: the official brackets, tax credits, MKB-winstvrijstelling (small-business profit exemption), zelfstandigenaftrek (self-employment deduction) and ZVW (the income-related health insurance contribution). Every formula is documented, so you can check each step yourself.
What does "−40% revenue" mean in the safety net chart?
A serious drop: suppose your income falls by forty percent from now on and stays at that level. The line shows how your reserves would develop, set against your current course and the zero-income scenario.
Your next decision doesn’t have to be a guess.
Start with four values and see what your next choice does to your numbers.
Get your first reading