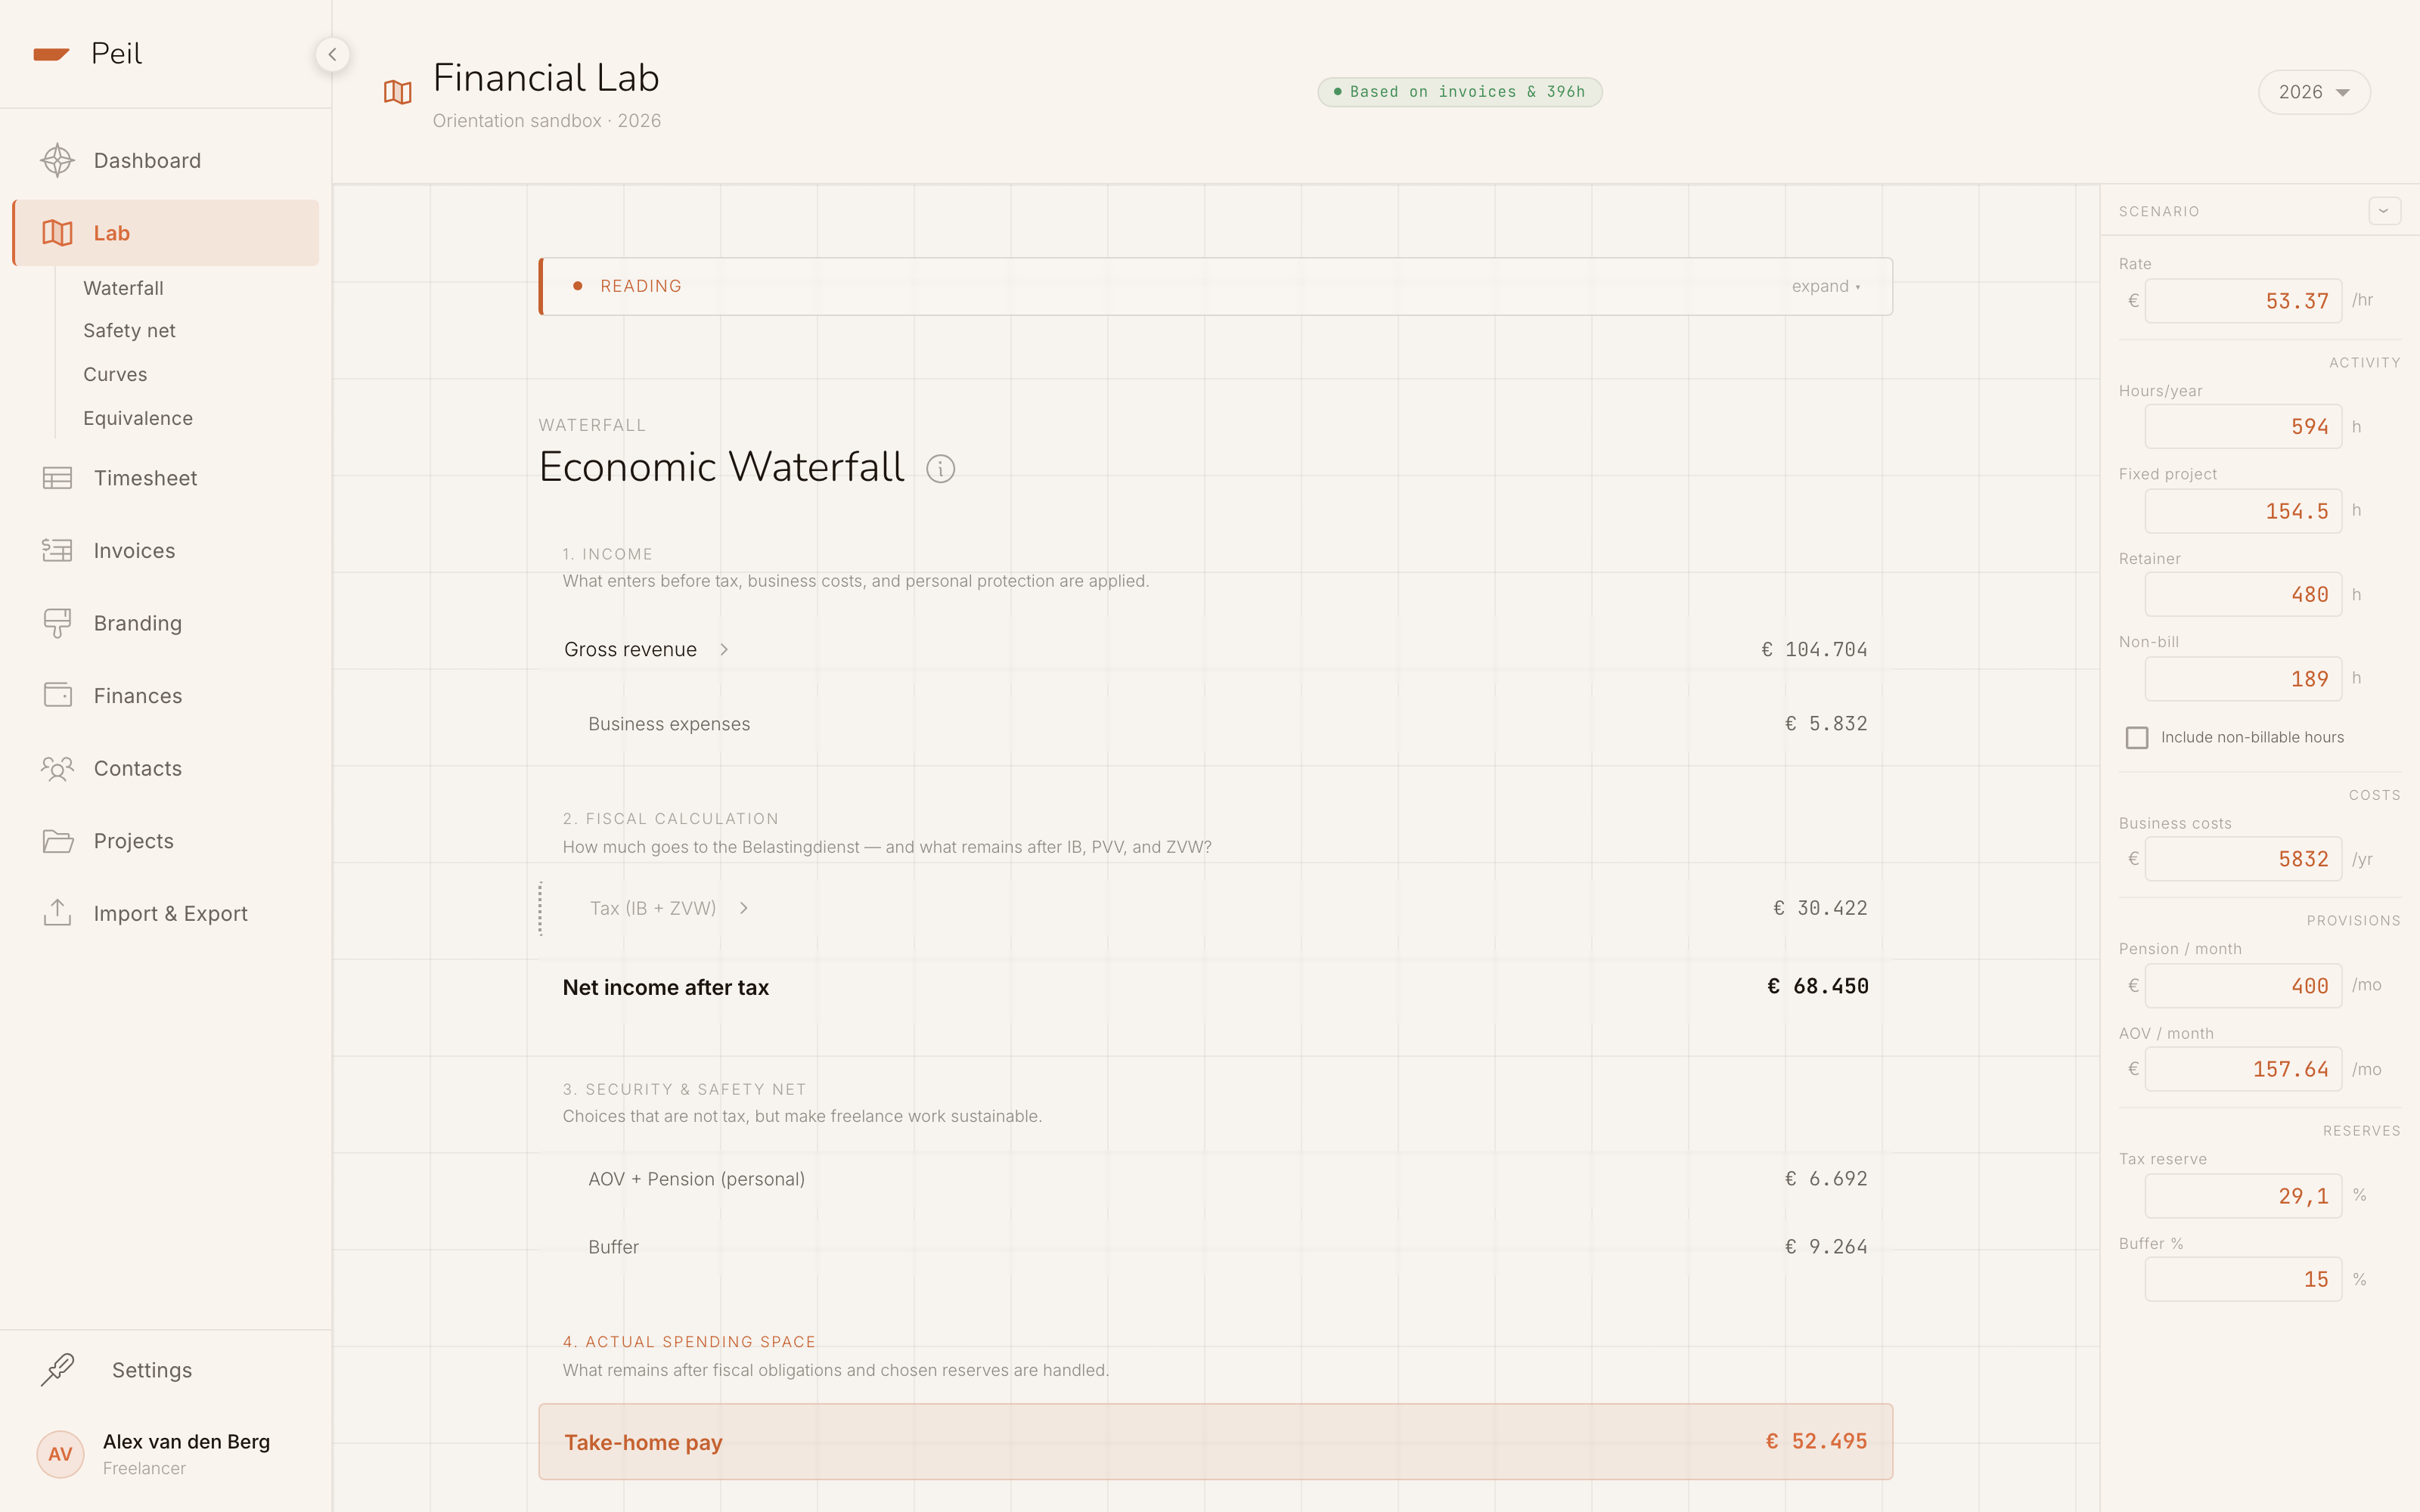
The Financial Lab is Peil's course explorer. Where the dashboard shows where you stand, the Lab shows what happens when you turn the dials: a higher rate, fewer hours, an extra set-aside. Every calculation is based on your real invoices and logged hours. You see that in the note at the top, for example "Based on invoices & 397 hours".
The Lab is a sandbox. Whatever you change here, it never touches your real data. Your hours, invoices and settings stay as they are; you're only exploring scenarios.
The scenario bar
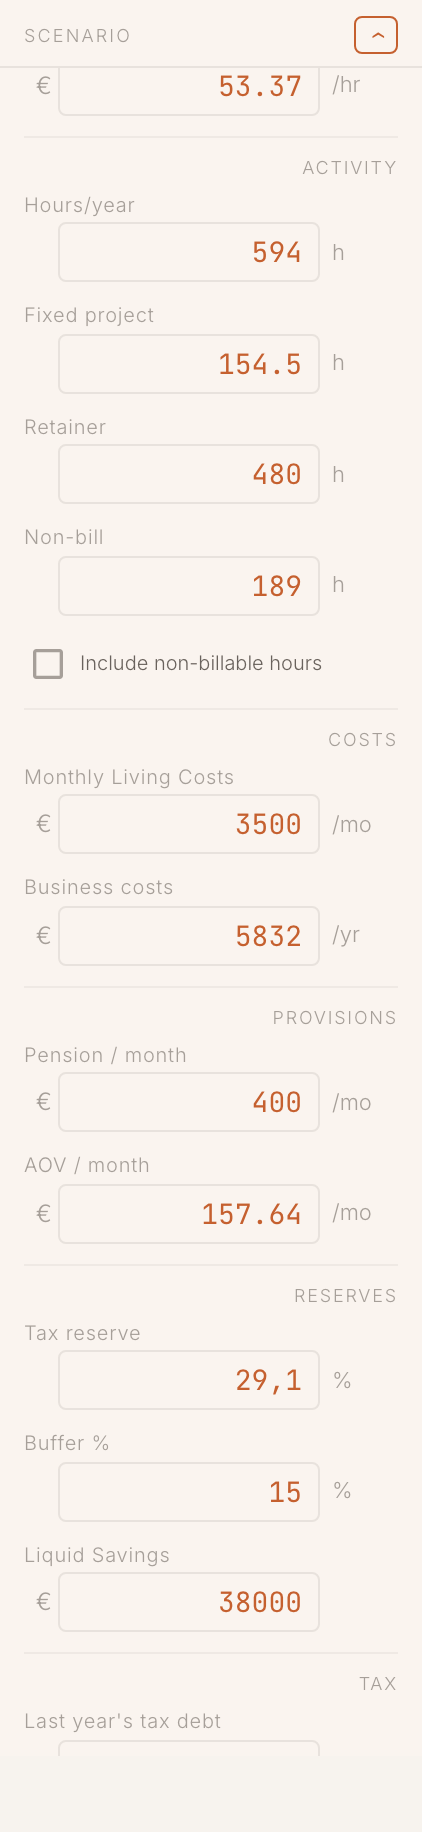
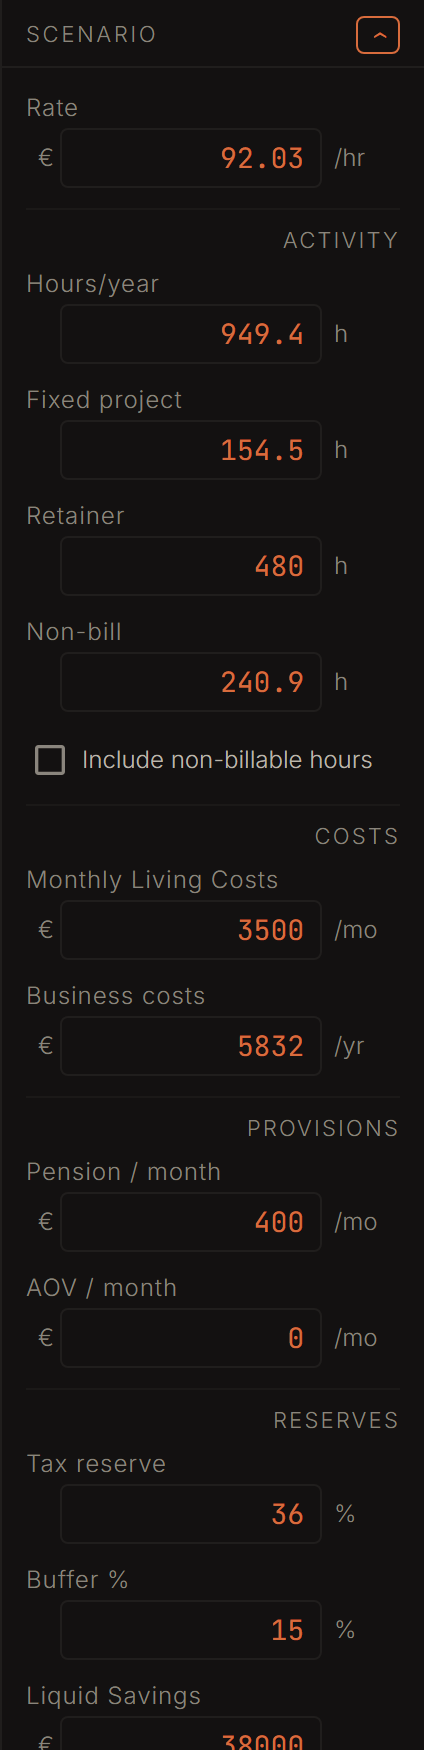
On the right sits the scenario bar: the controls that recalculate the whole Lab live. You change a value and every analysis on the page moves with it. The main controls:
- Rate — your hourly rate.
- Hours/year and non-billable hours — your expected workload. The "Incl. non-billable" switch decides whether internal hours count toward the net effective rate.
- AOV / month — your disability insurance premium.
- Tax reserve % and Buffer % — how much of each euro you set aside.
"Expand" reveals extra controls for retainer and fixed-price hours, deductible costs and pension. As soon as you change something, an Edited label appears; Reset puts everything back to your real values.
Adjusting the scenario bar live is part of Peil Pro. The analyses themselves (the waterfall, the safety-net analysis, the curves and the employment comparison) you view for free on your own figures.
The Waterfall
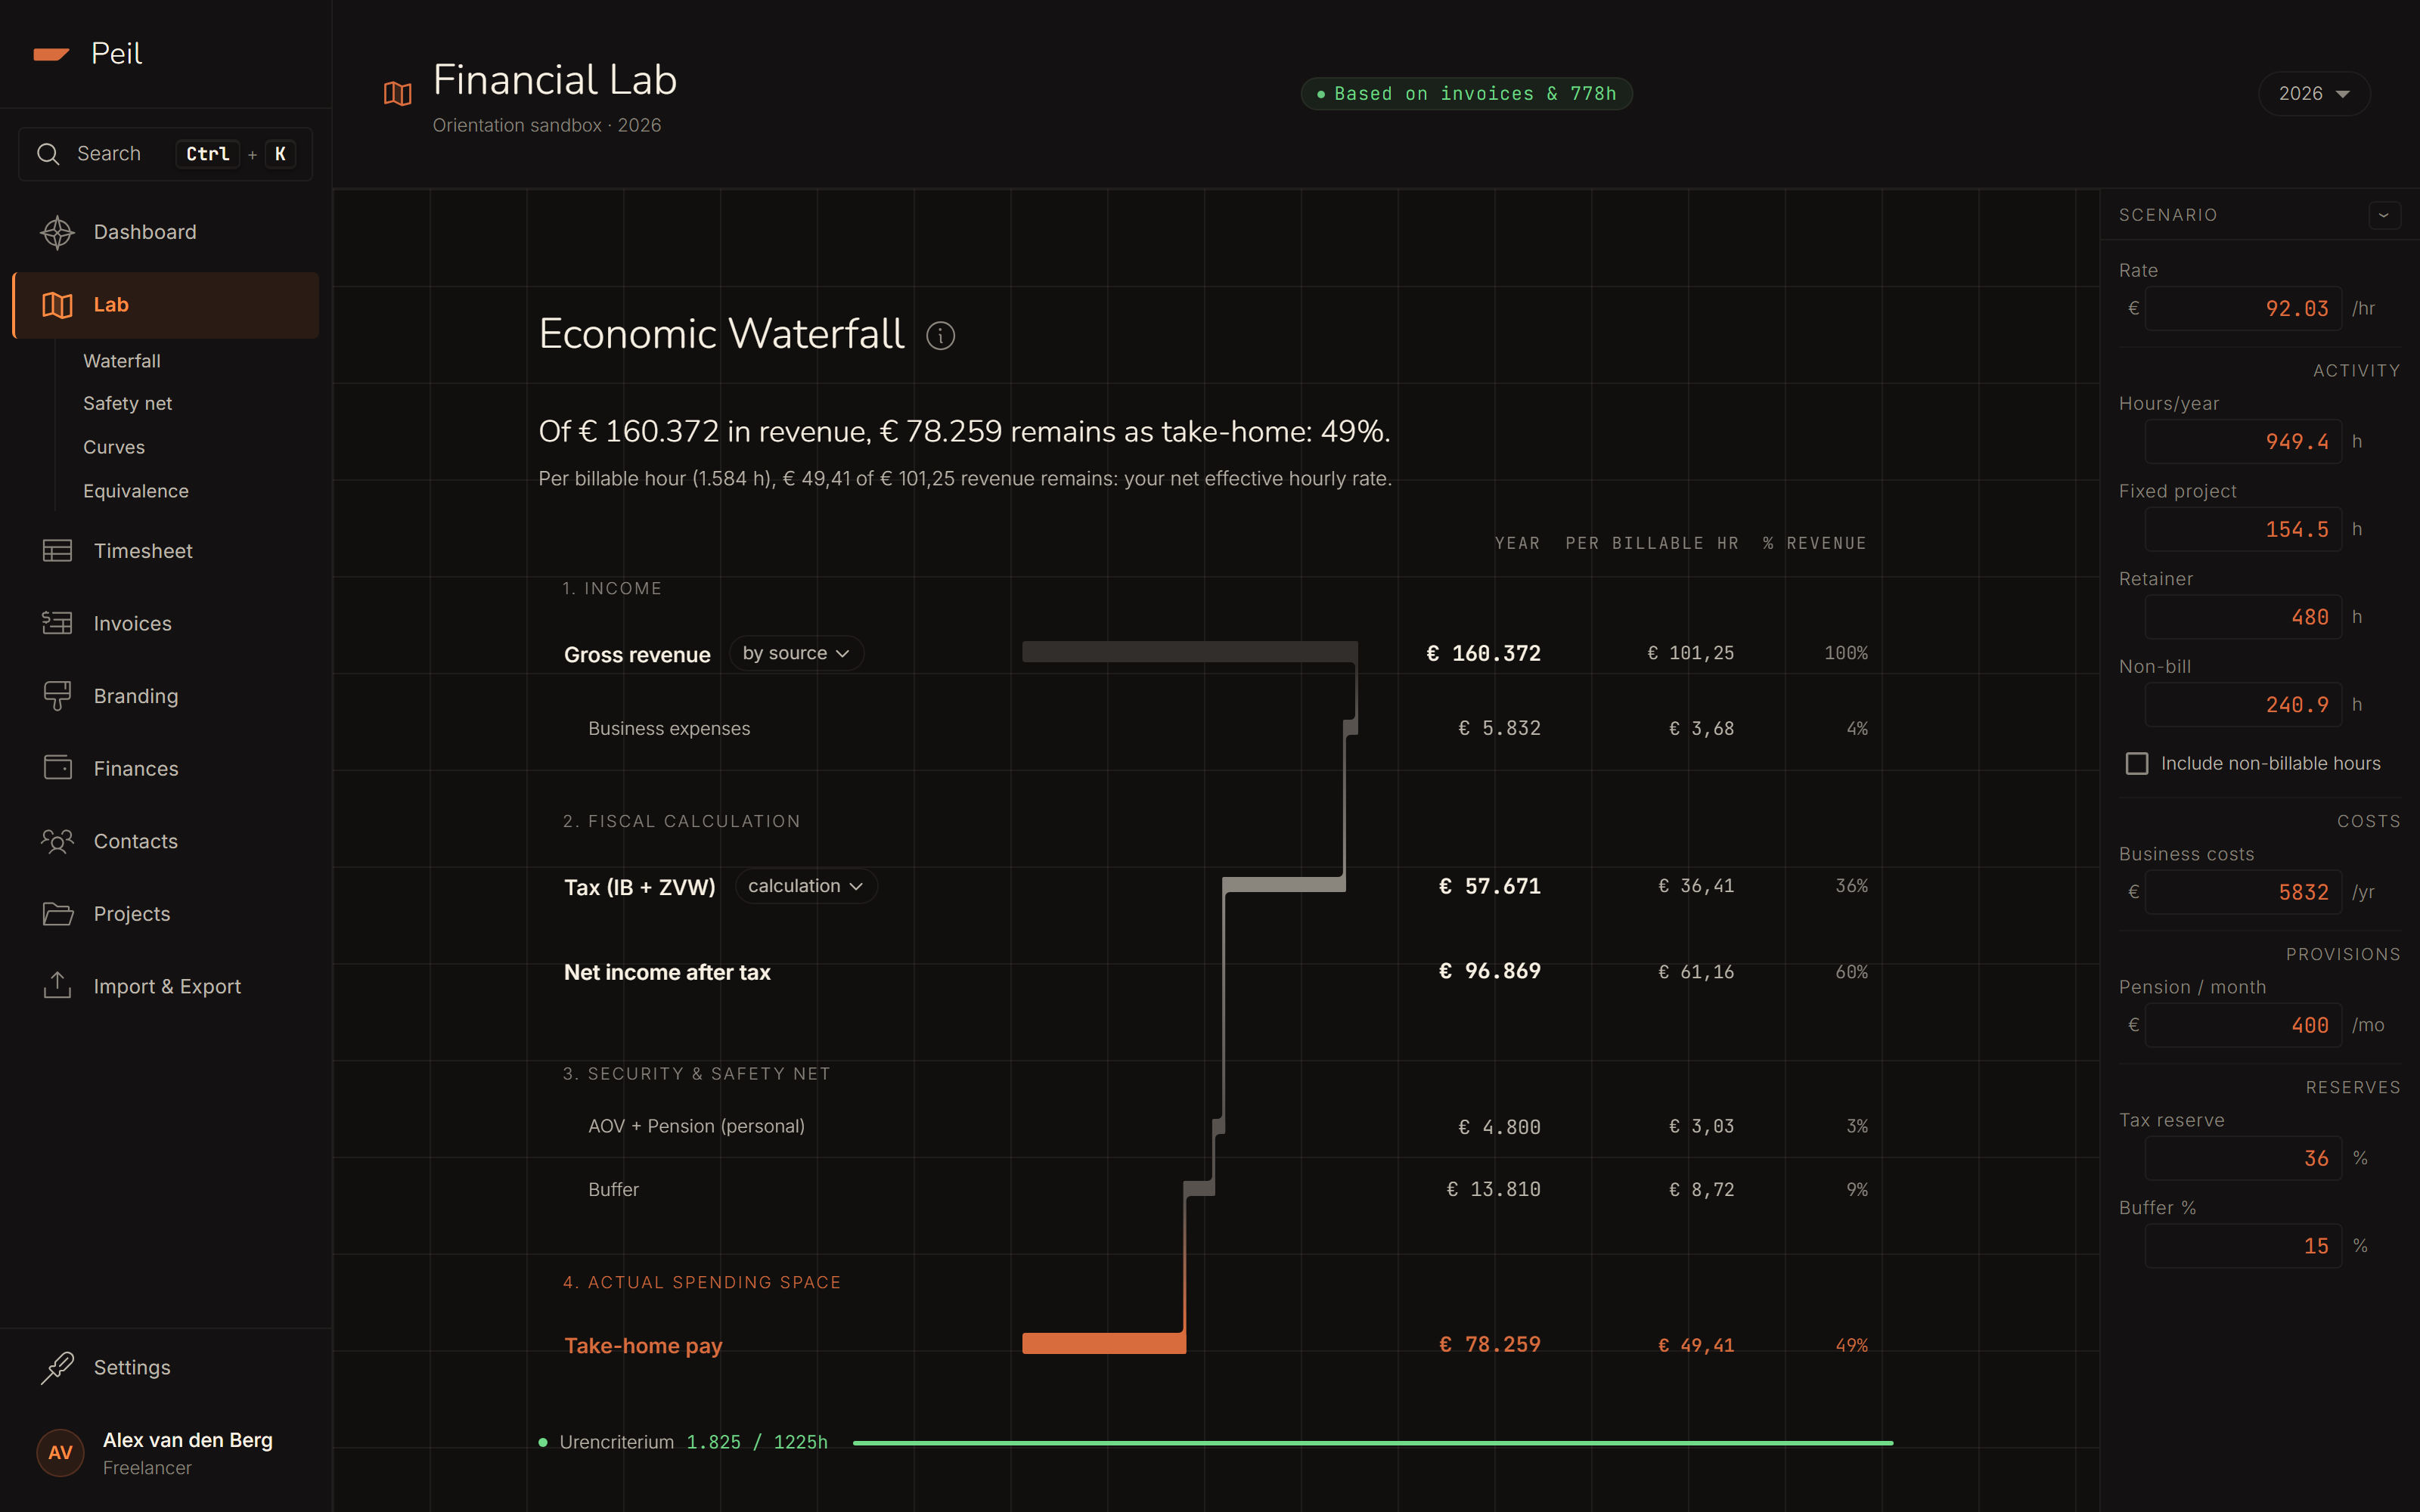
The waterfall follows one euro of revenue from top to bottom, through four layers, down to what actually remains:
- Income — your gross revenue, before anything comes off.
- Tax calculation — what goes to the tax office (income tax, national insurance and the ZVW contribution), and what remains net after tax.
- Security & safety net — the choices that aren't tax but are needed to make self-employment sustainable: AOV, pension and building your buffer.
- Actual room to spend — your take-home pay: what you can pay yourself as personal income after tax, provisions and buffer are handled.
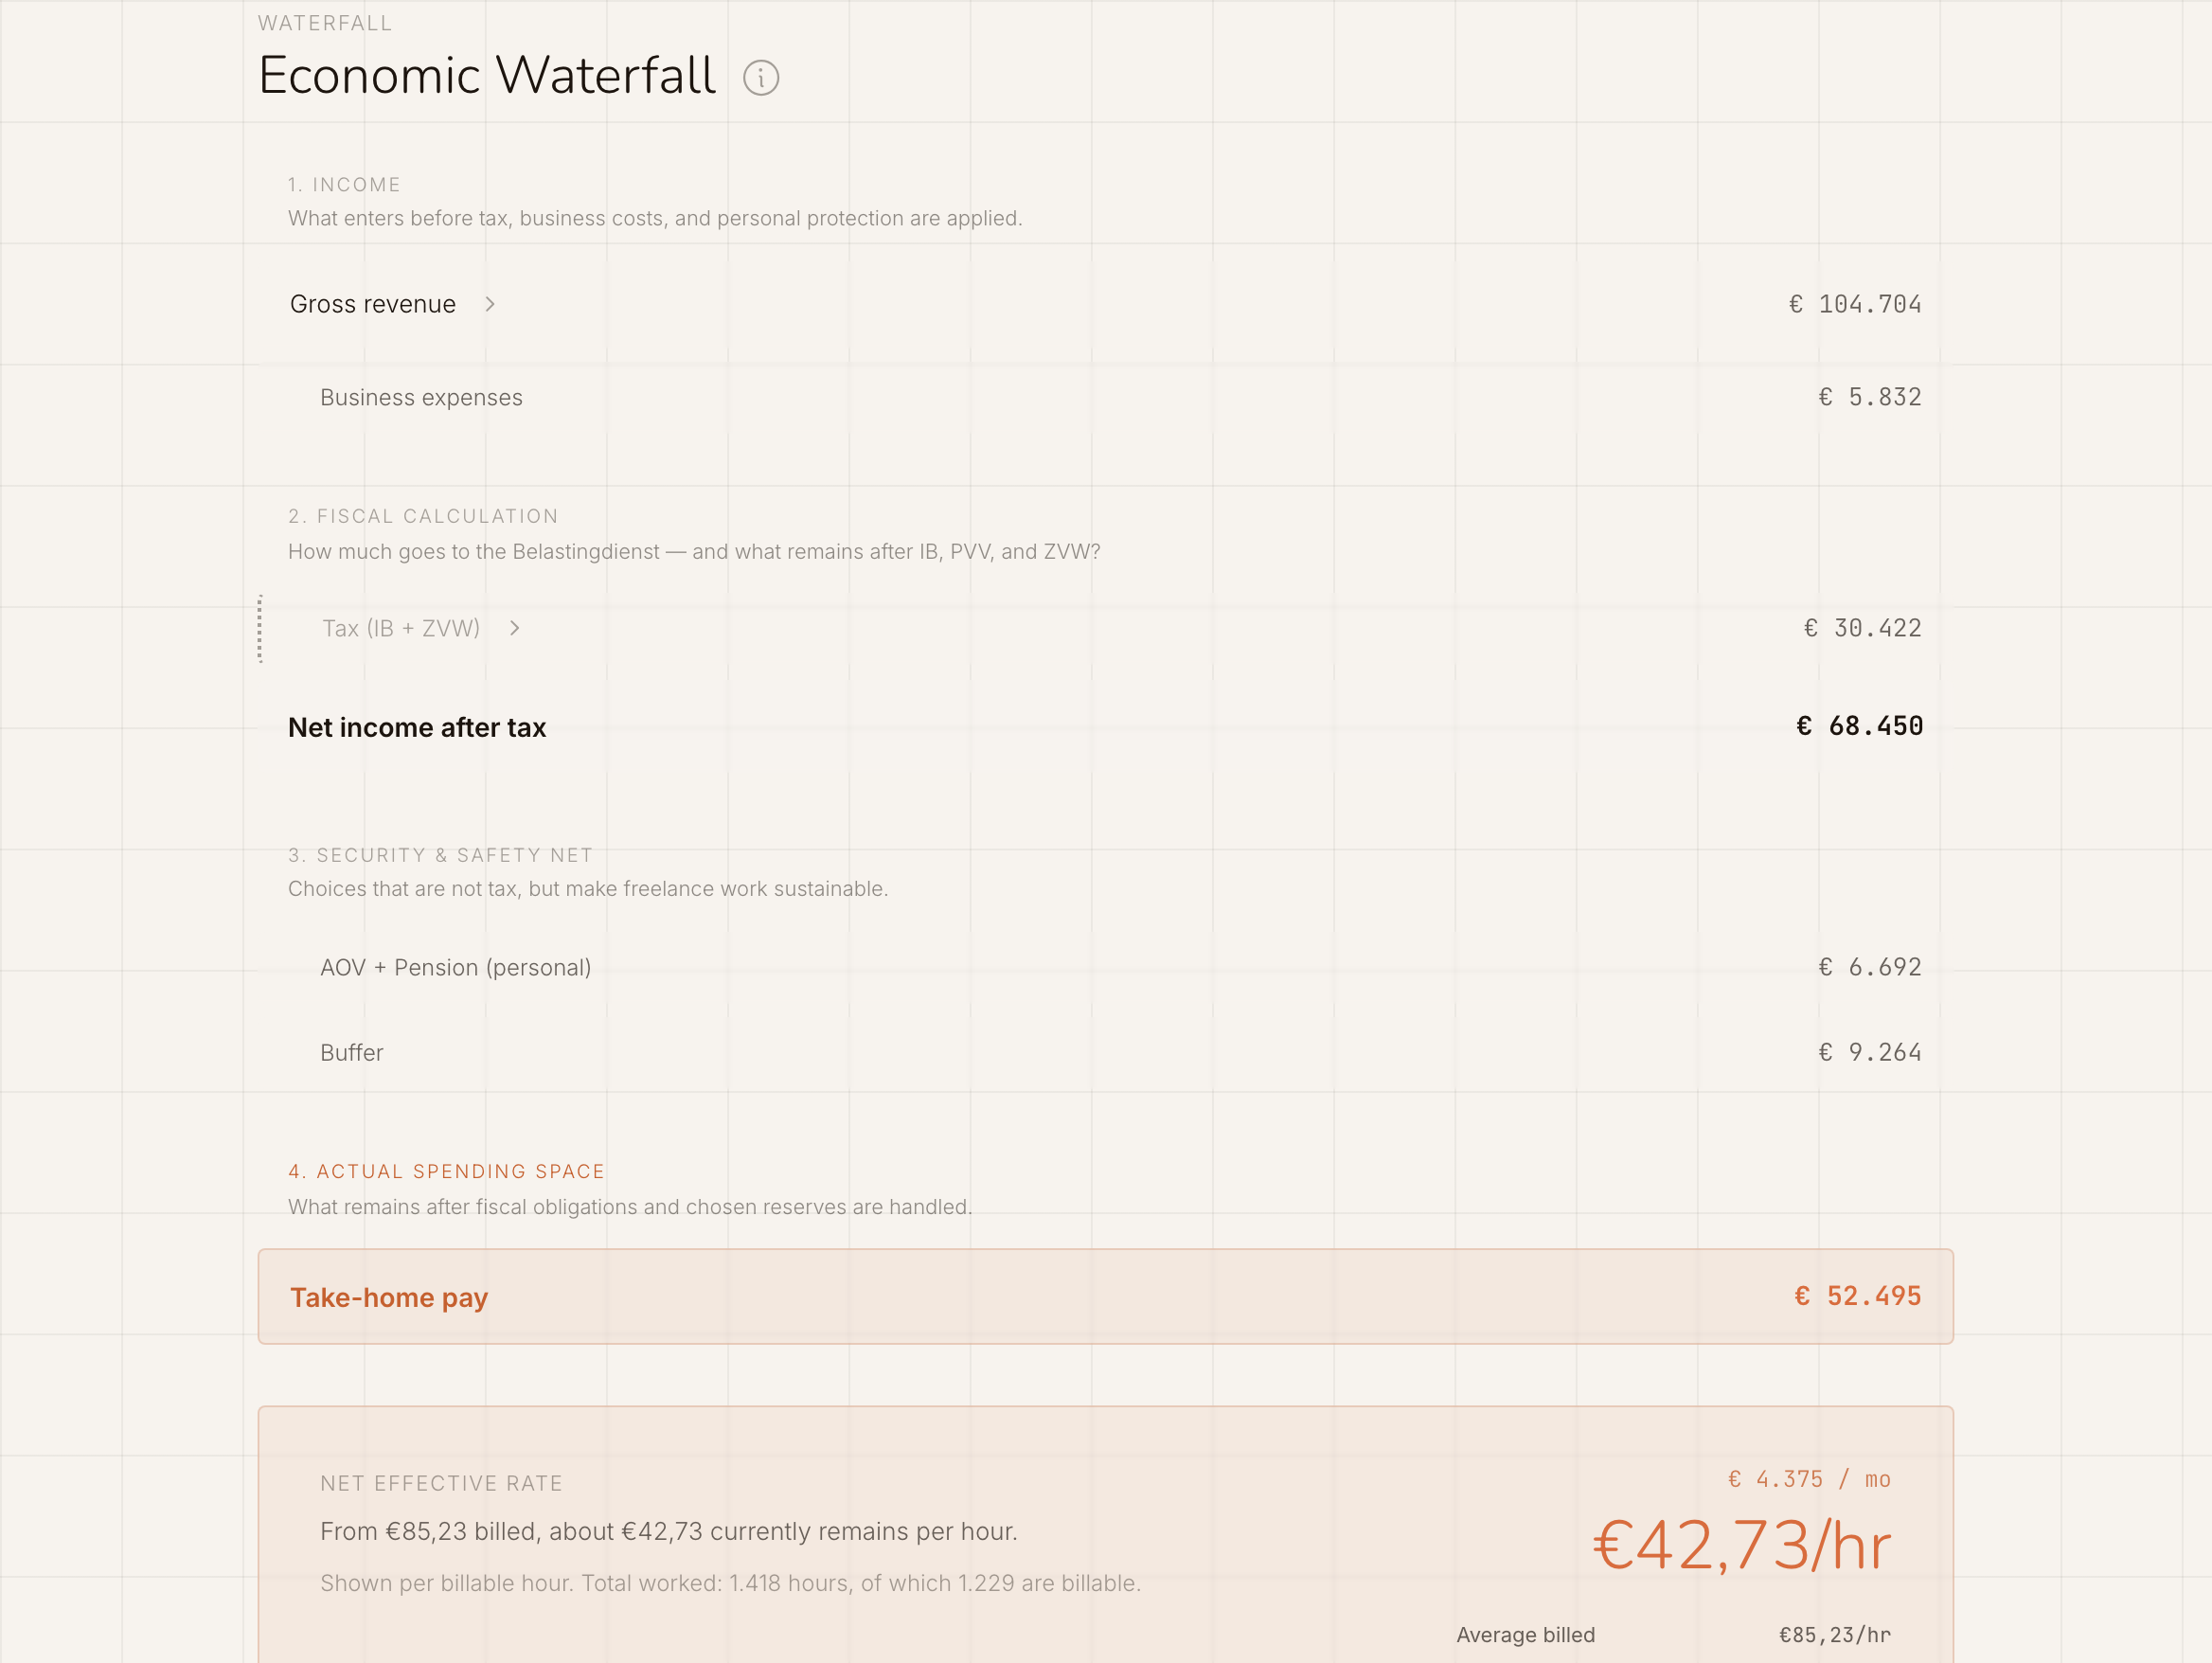
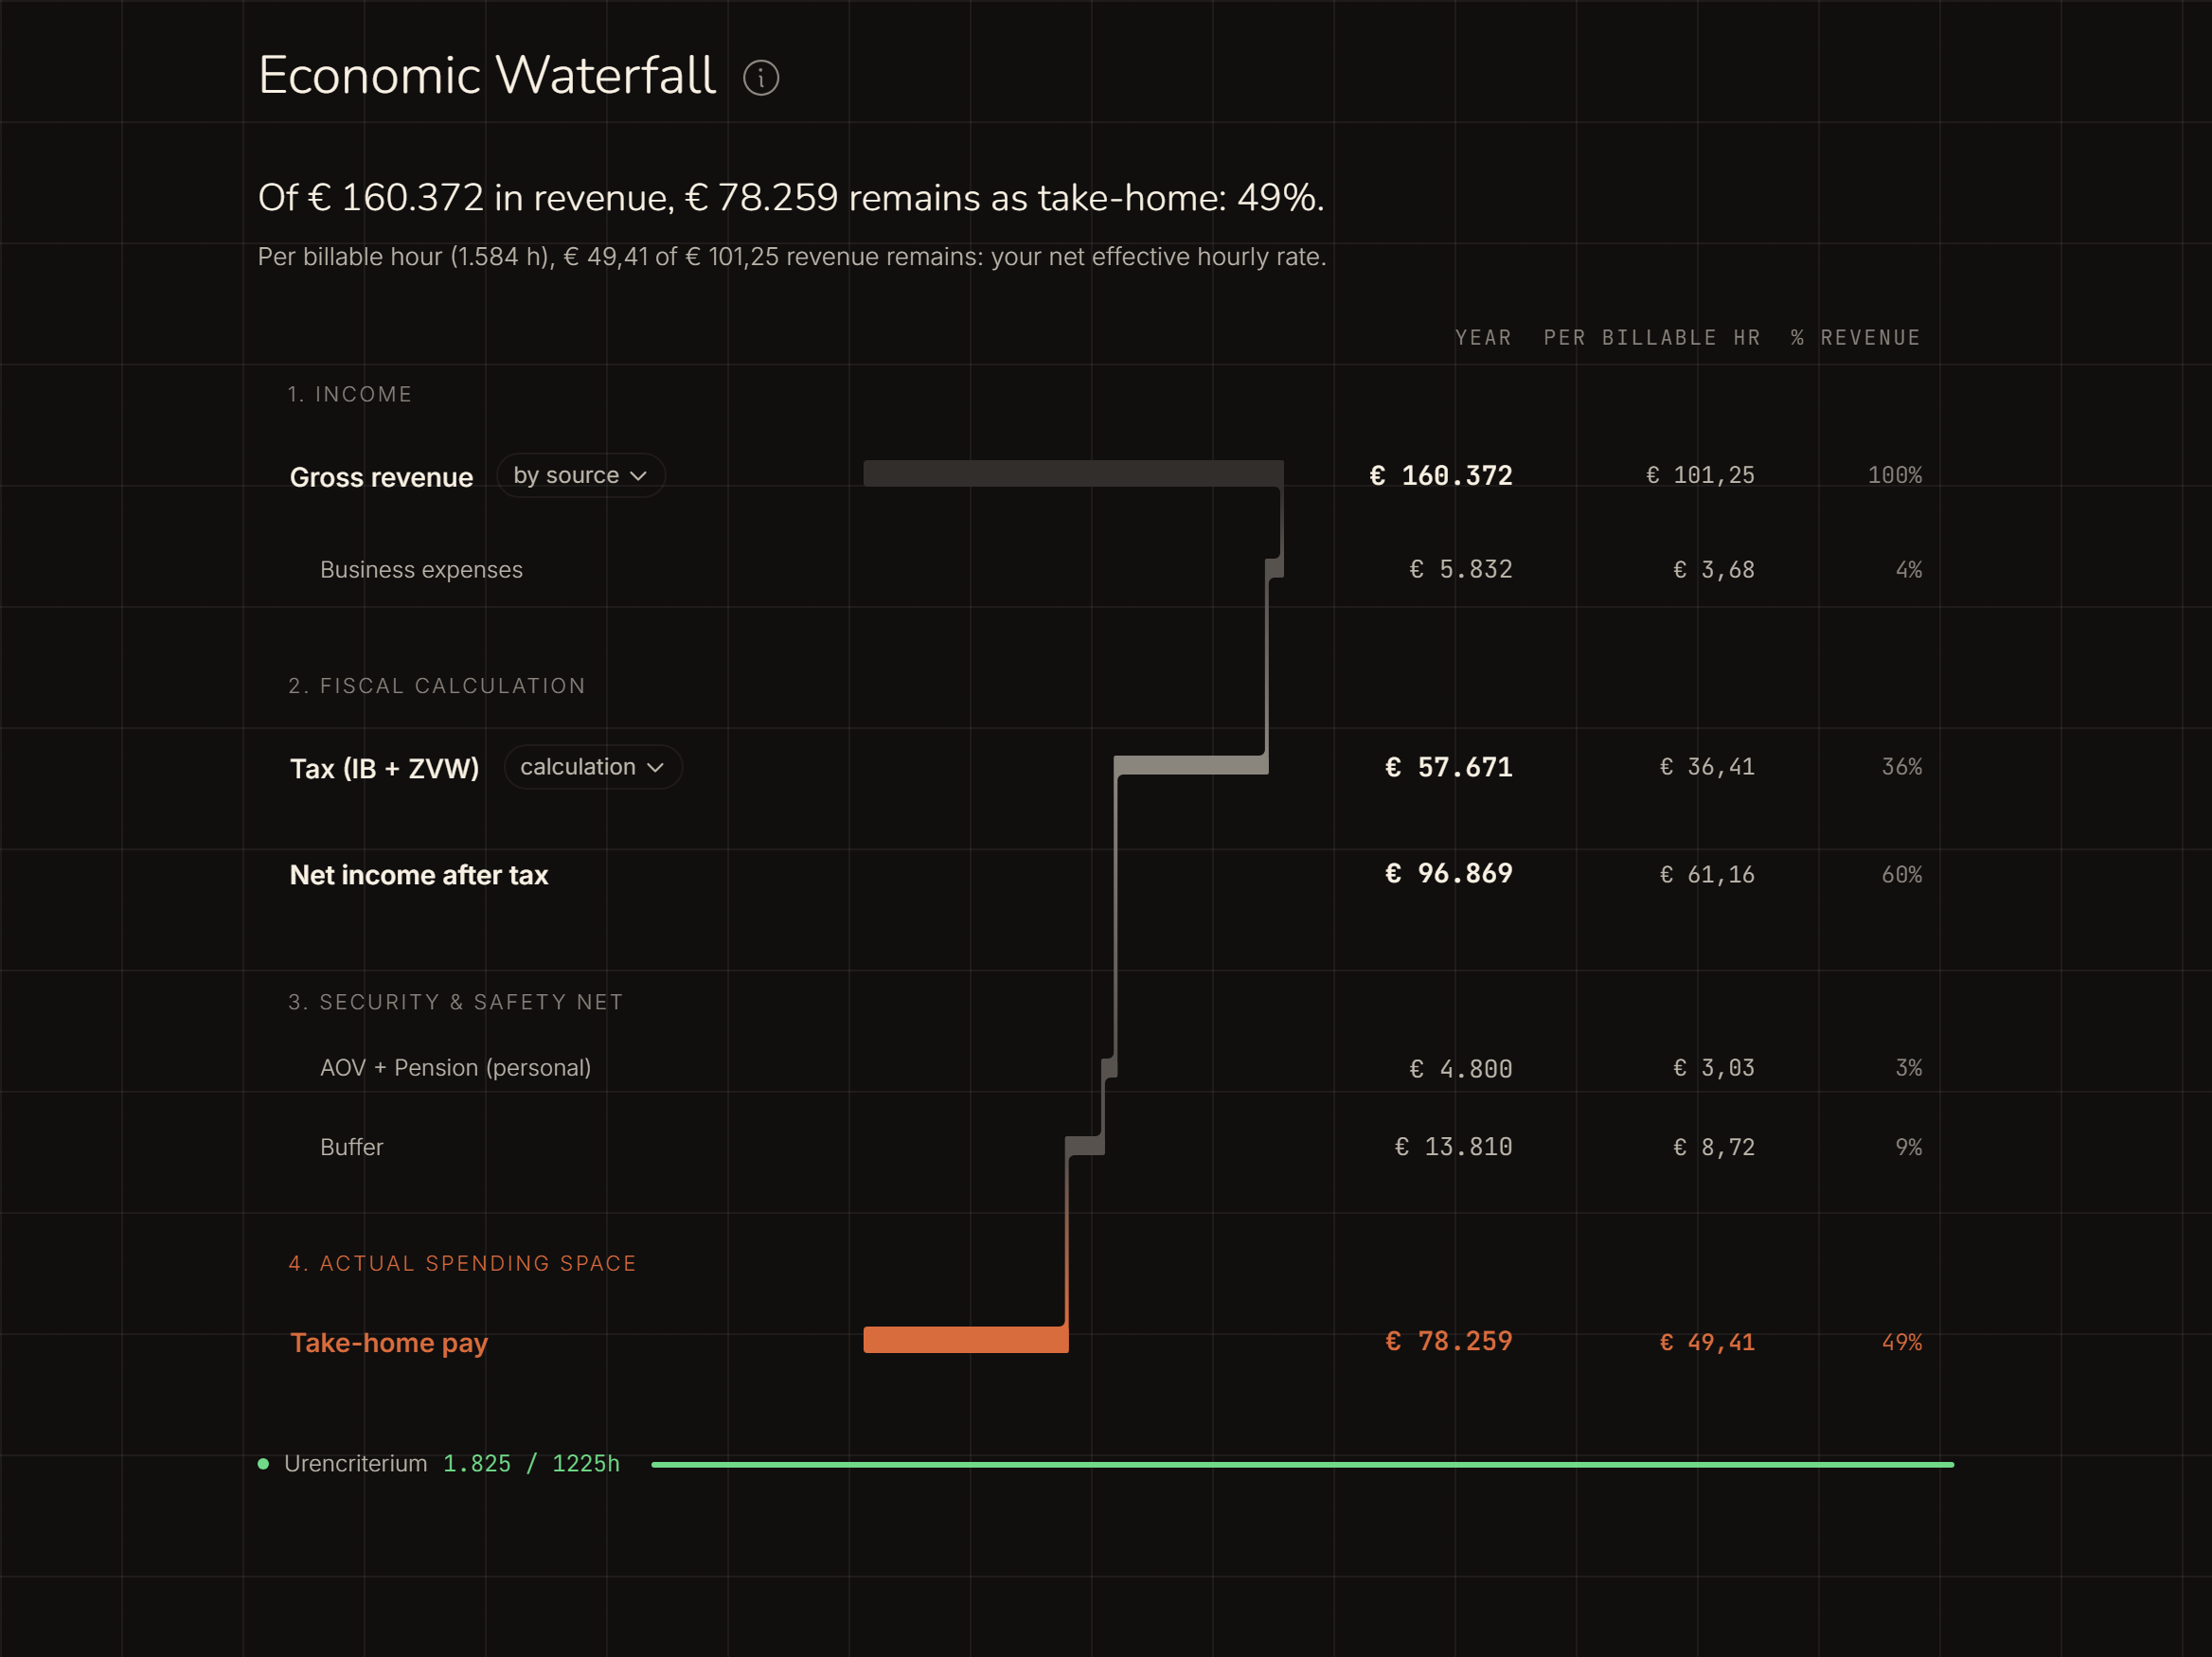
AOV appears under personal deductions, not business costs. Here, "personal" doesn't mean a non-deductible private expense. The Dutch Tax Administration calls qualifying AOV premiums uitgaven voor inkomensvoorzieningen (income-provision expenses). They do not reduce turnover or business profit; they reduce taxable Box 1 income, after the MKB profit exemption. The policy must meet the conditions, including periodic payouts. See the Tax Administration's conditions.
This is the same logic as the net effective hourly rate, but as an amount across the whole year. See NER explained for the per-hour formula.
Safety-net analysis
The safety-net analysis translates the waterfall into a monthly picture and a timeline. At the top is your monthly position: gross income per month, minus tax reservation and provisions, is what's available for personal life, set against what you need at a minimum. The balance shows in a single figure whether your month adds up.
Below it, Peil draws three savings scenarios in one graph, so you don't rely on a single optimistic assumption:
- Current course — your reserves at an unchanged pace.
- −40% revenue — a sharp drop.
- Zero income — how long your safety net lasts if work stops entirely.
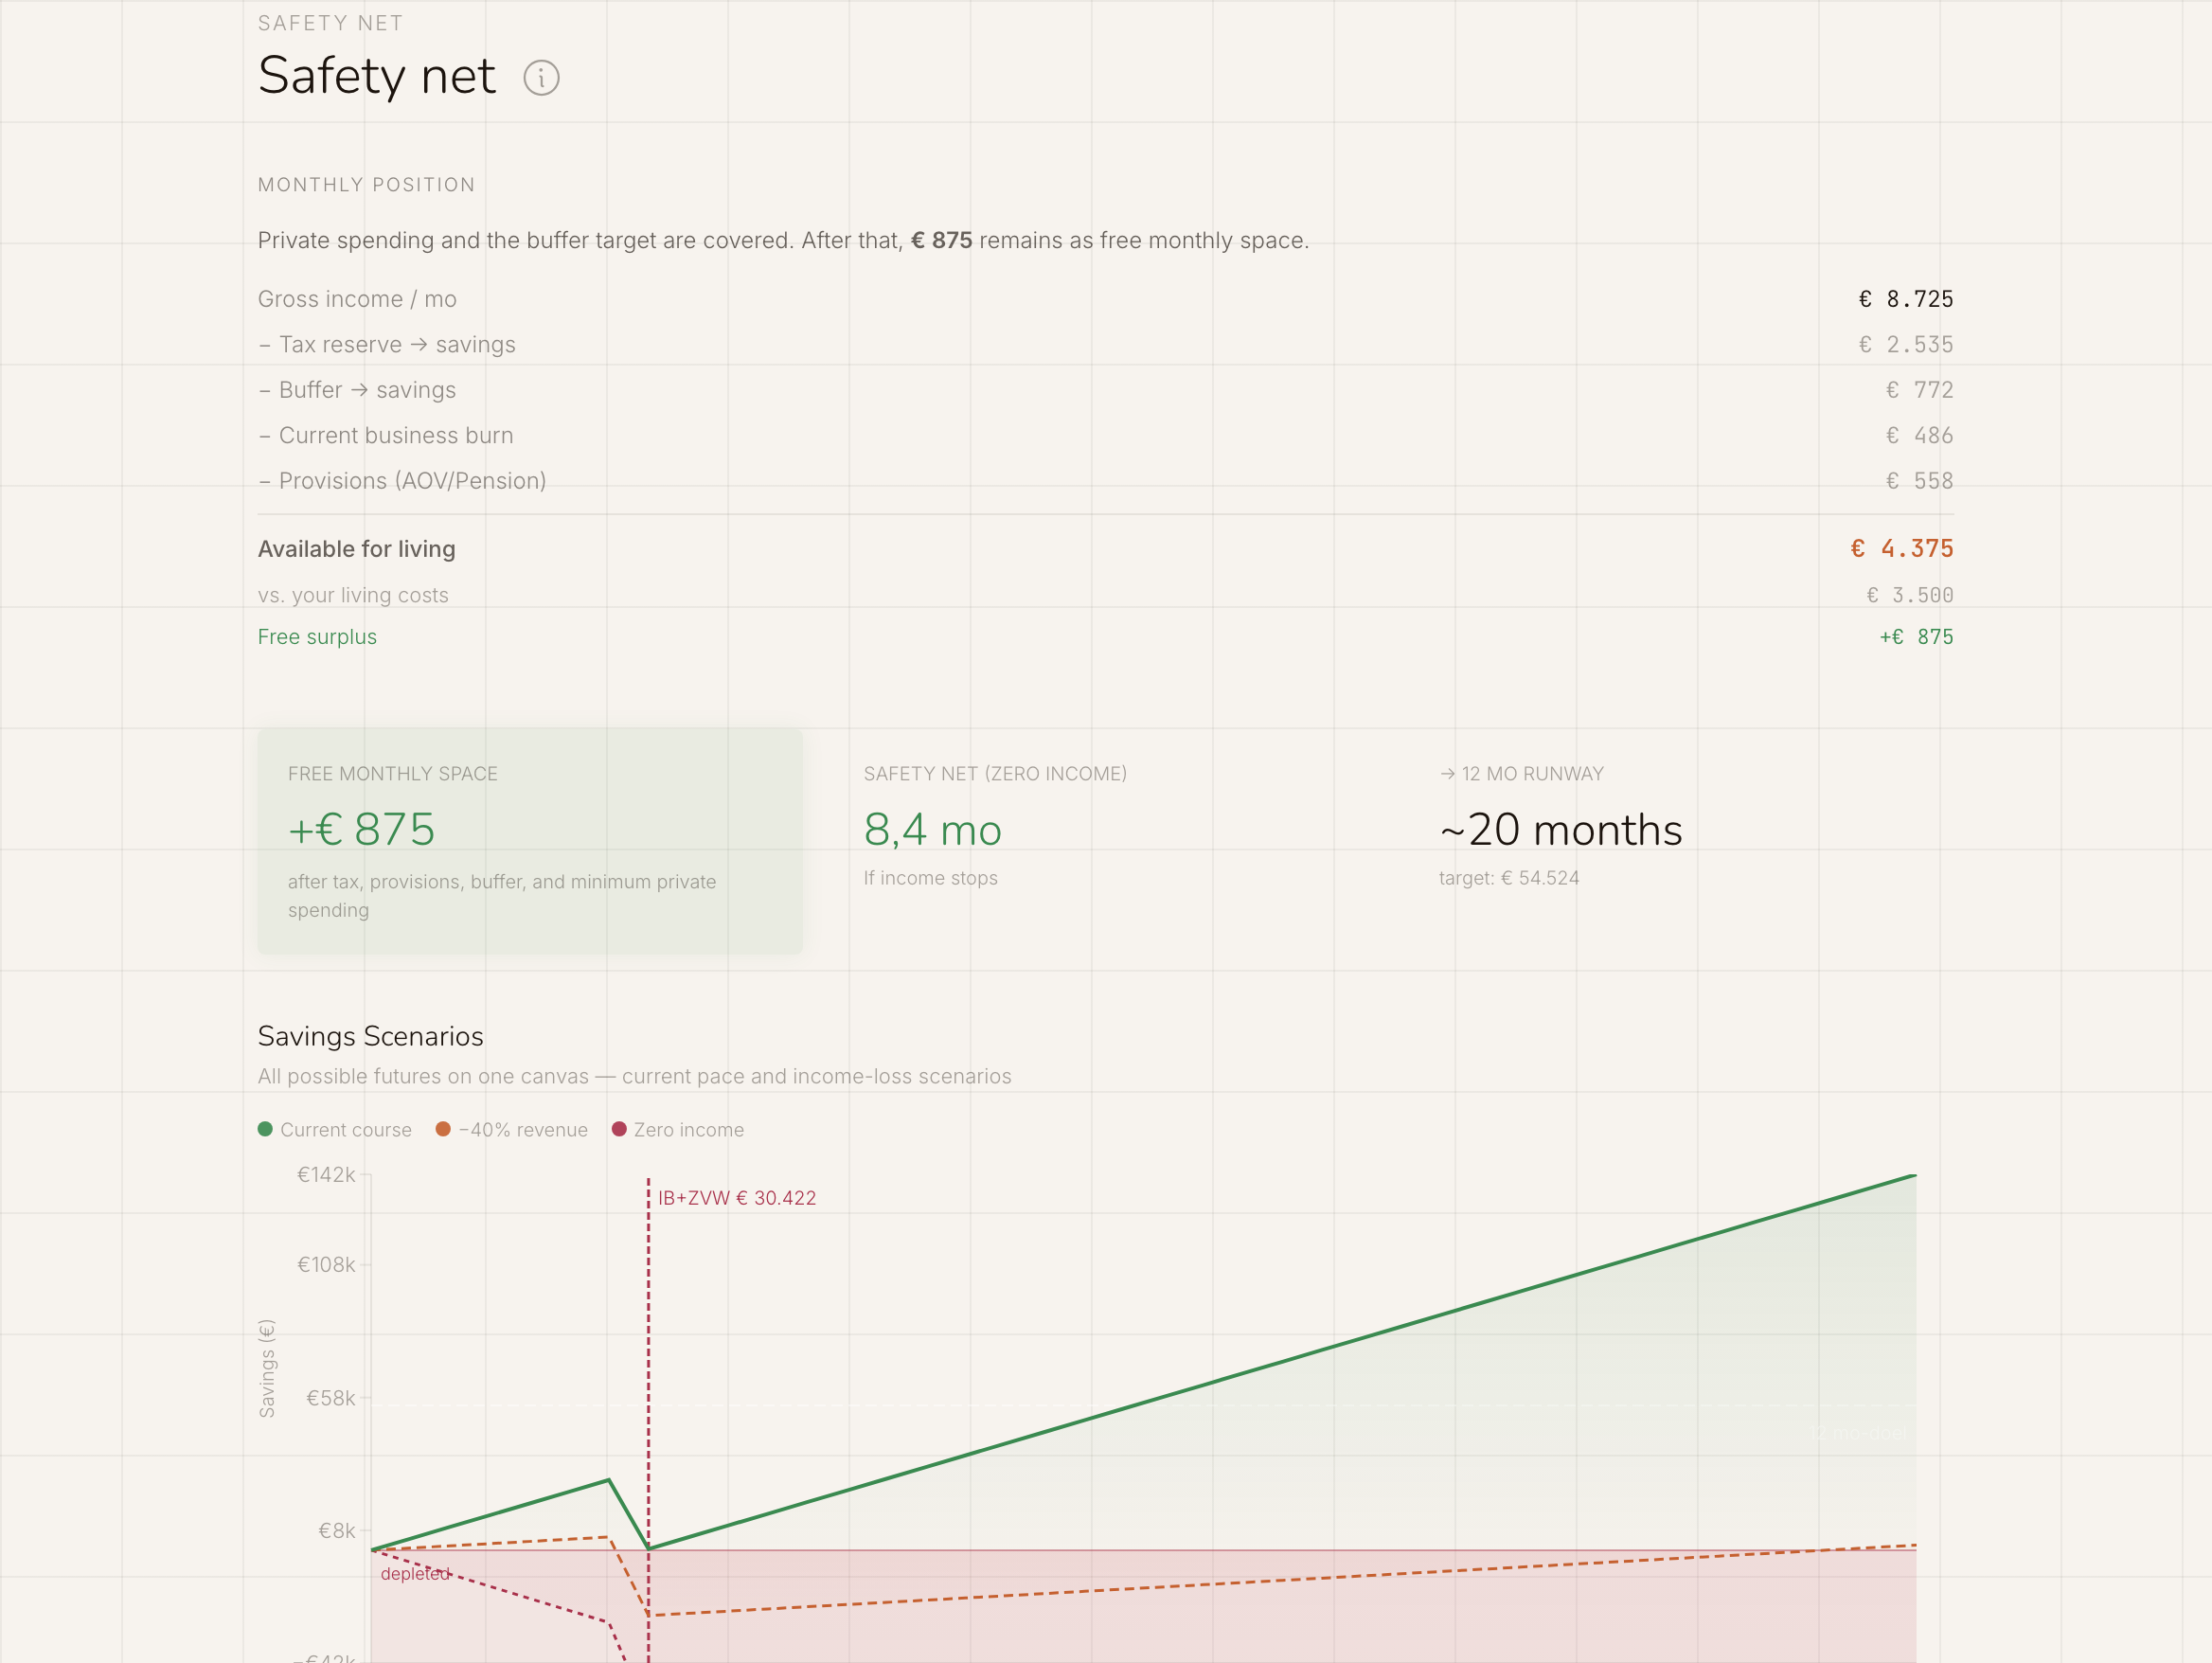
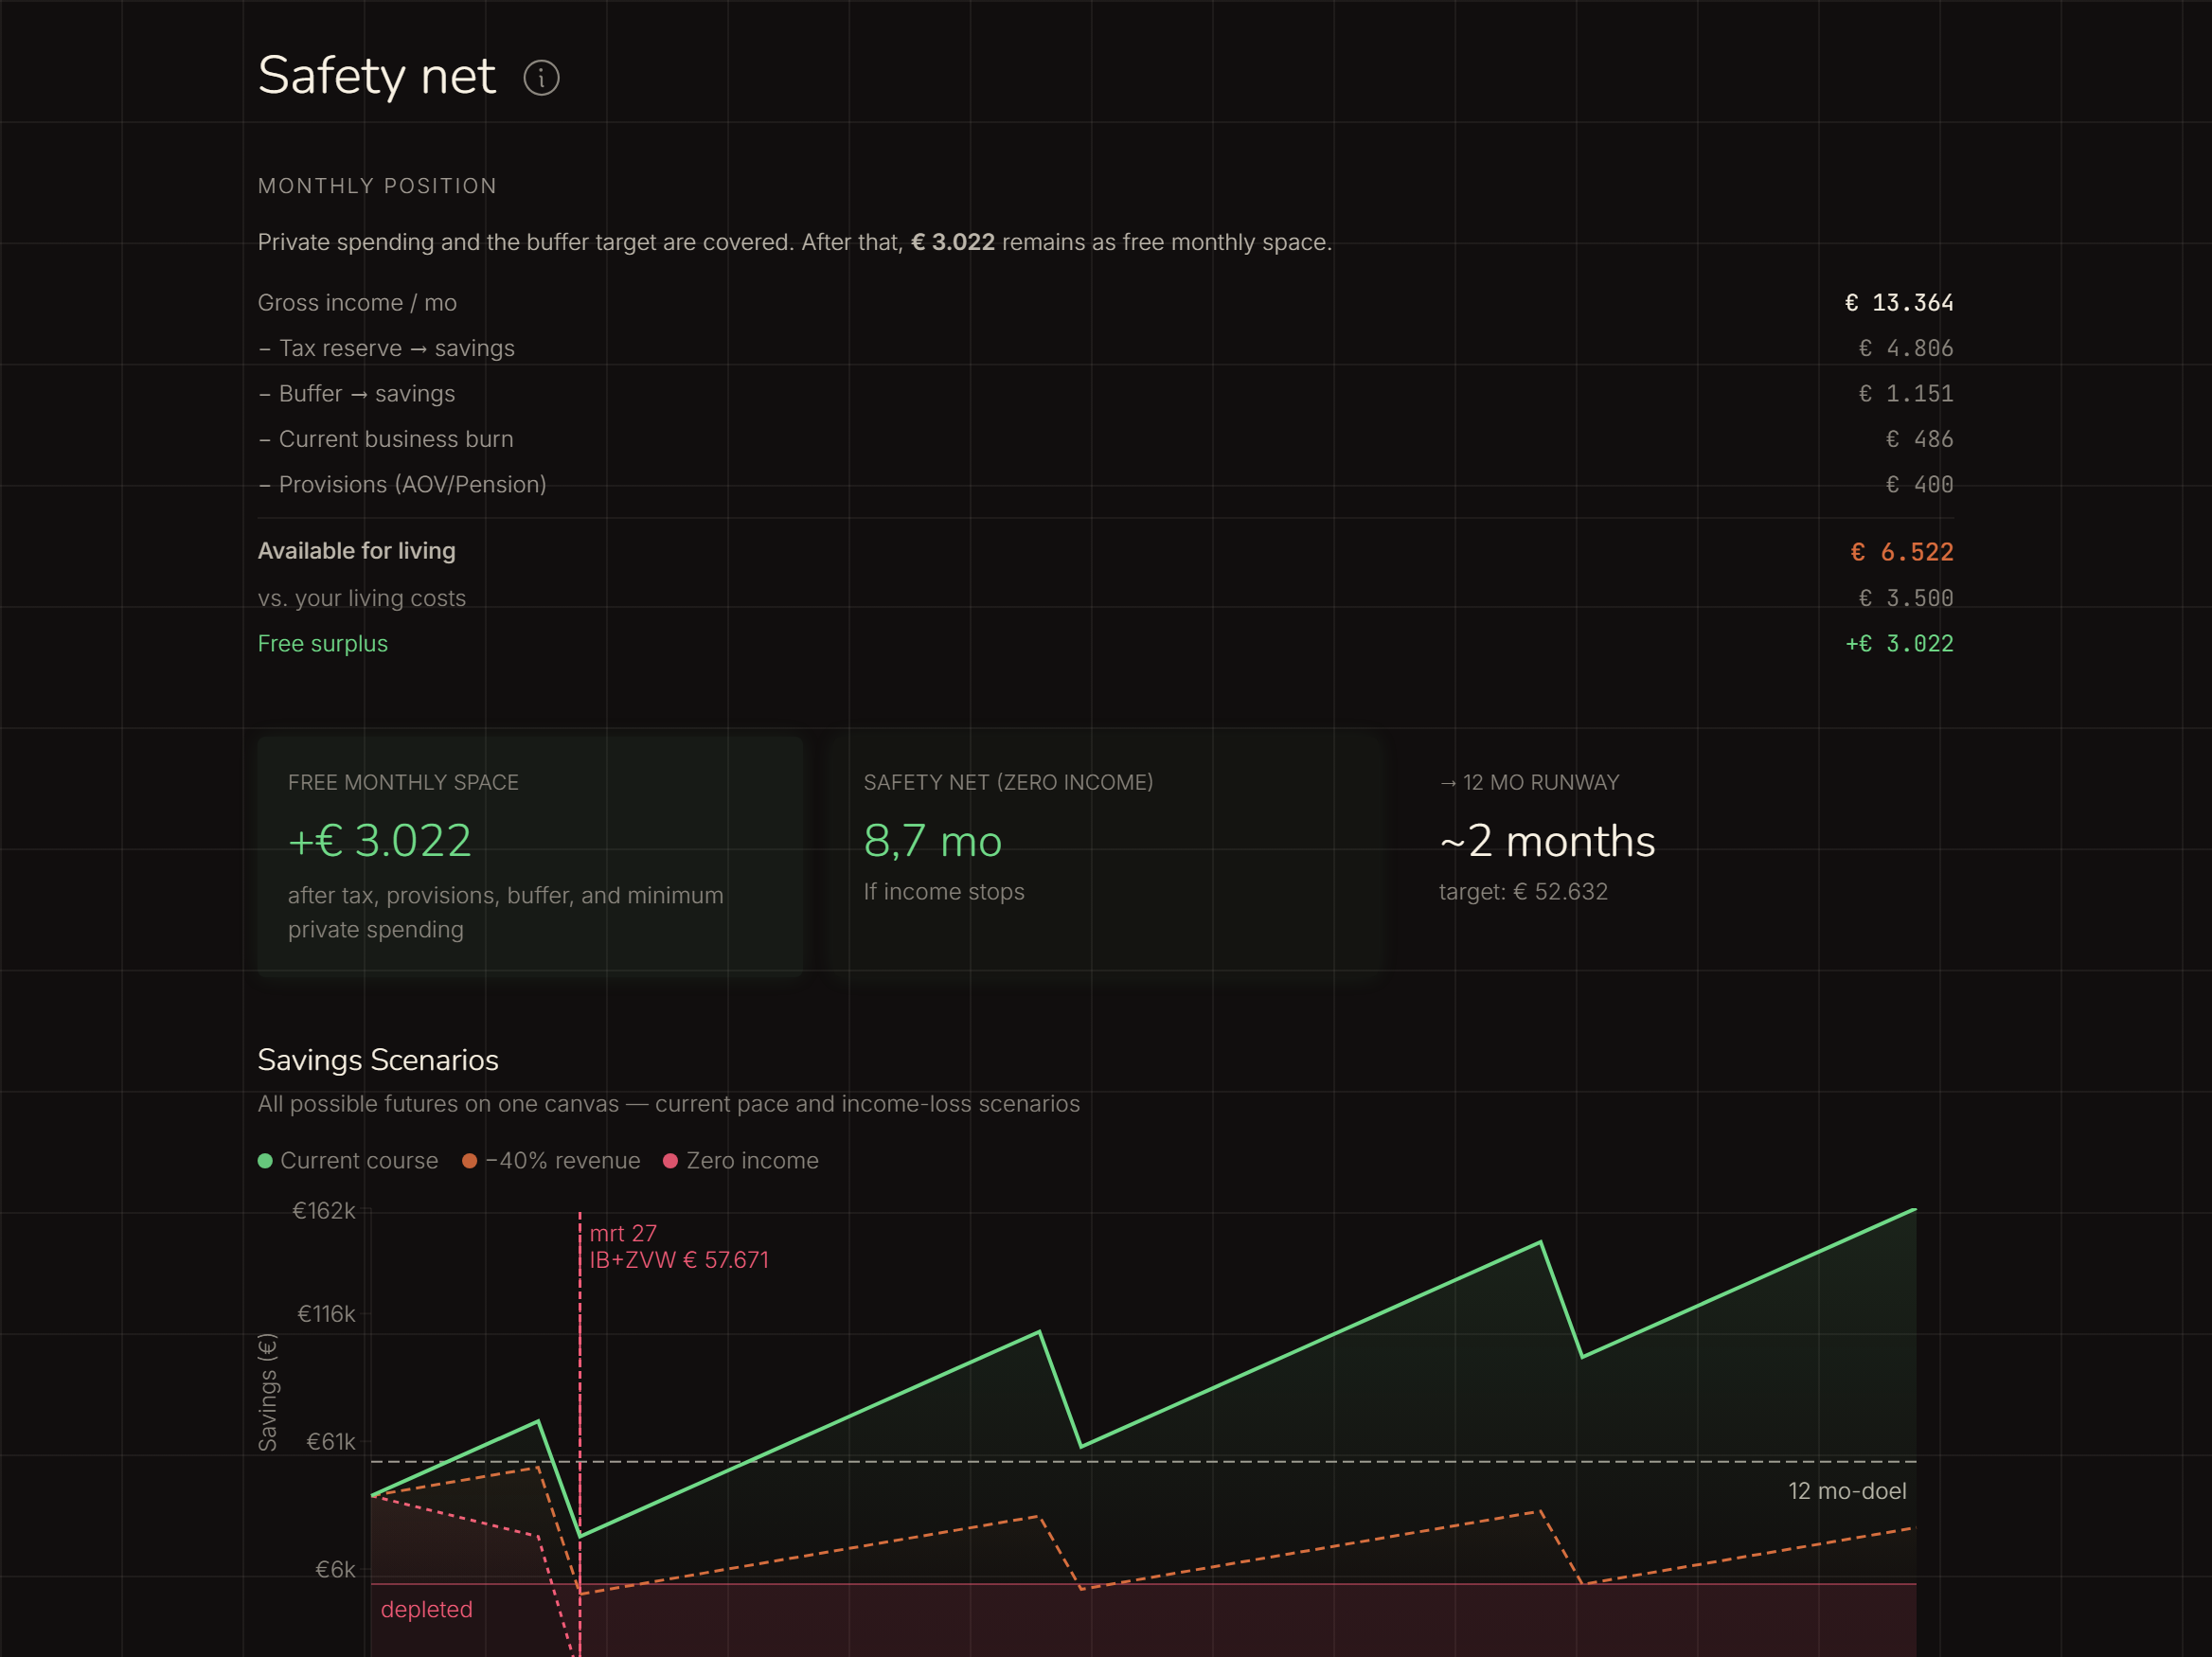
More on reserve build-up and the three scenarios in Safety net & horizon and Tax reserve.
Curves: the tax landscape
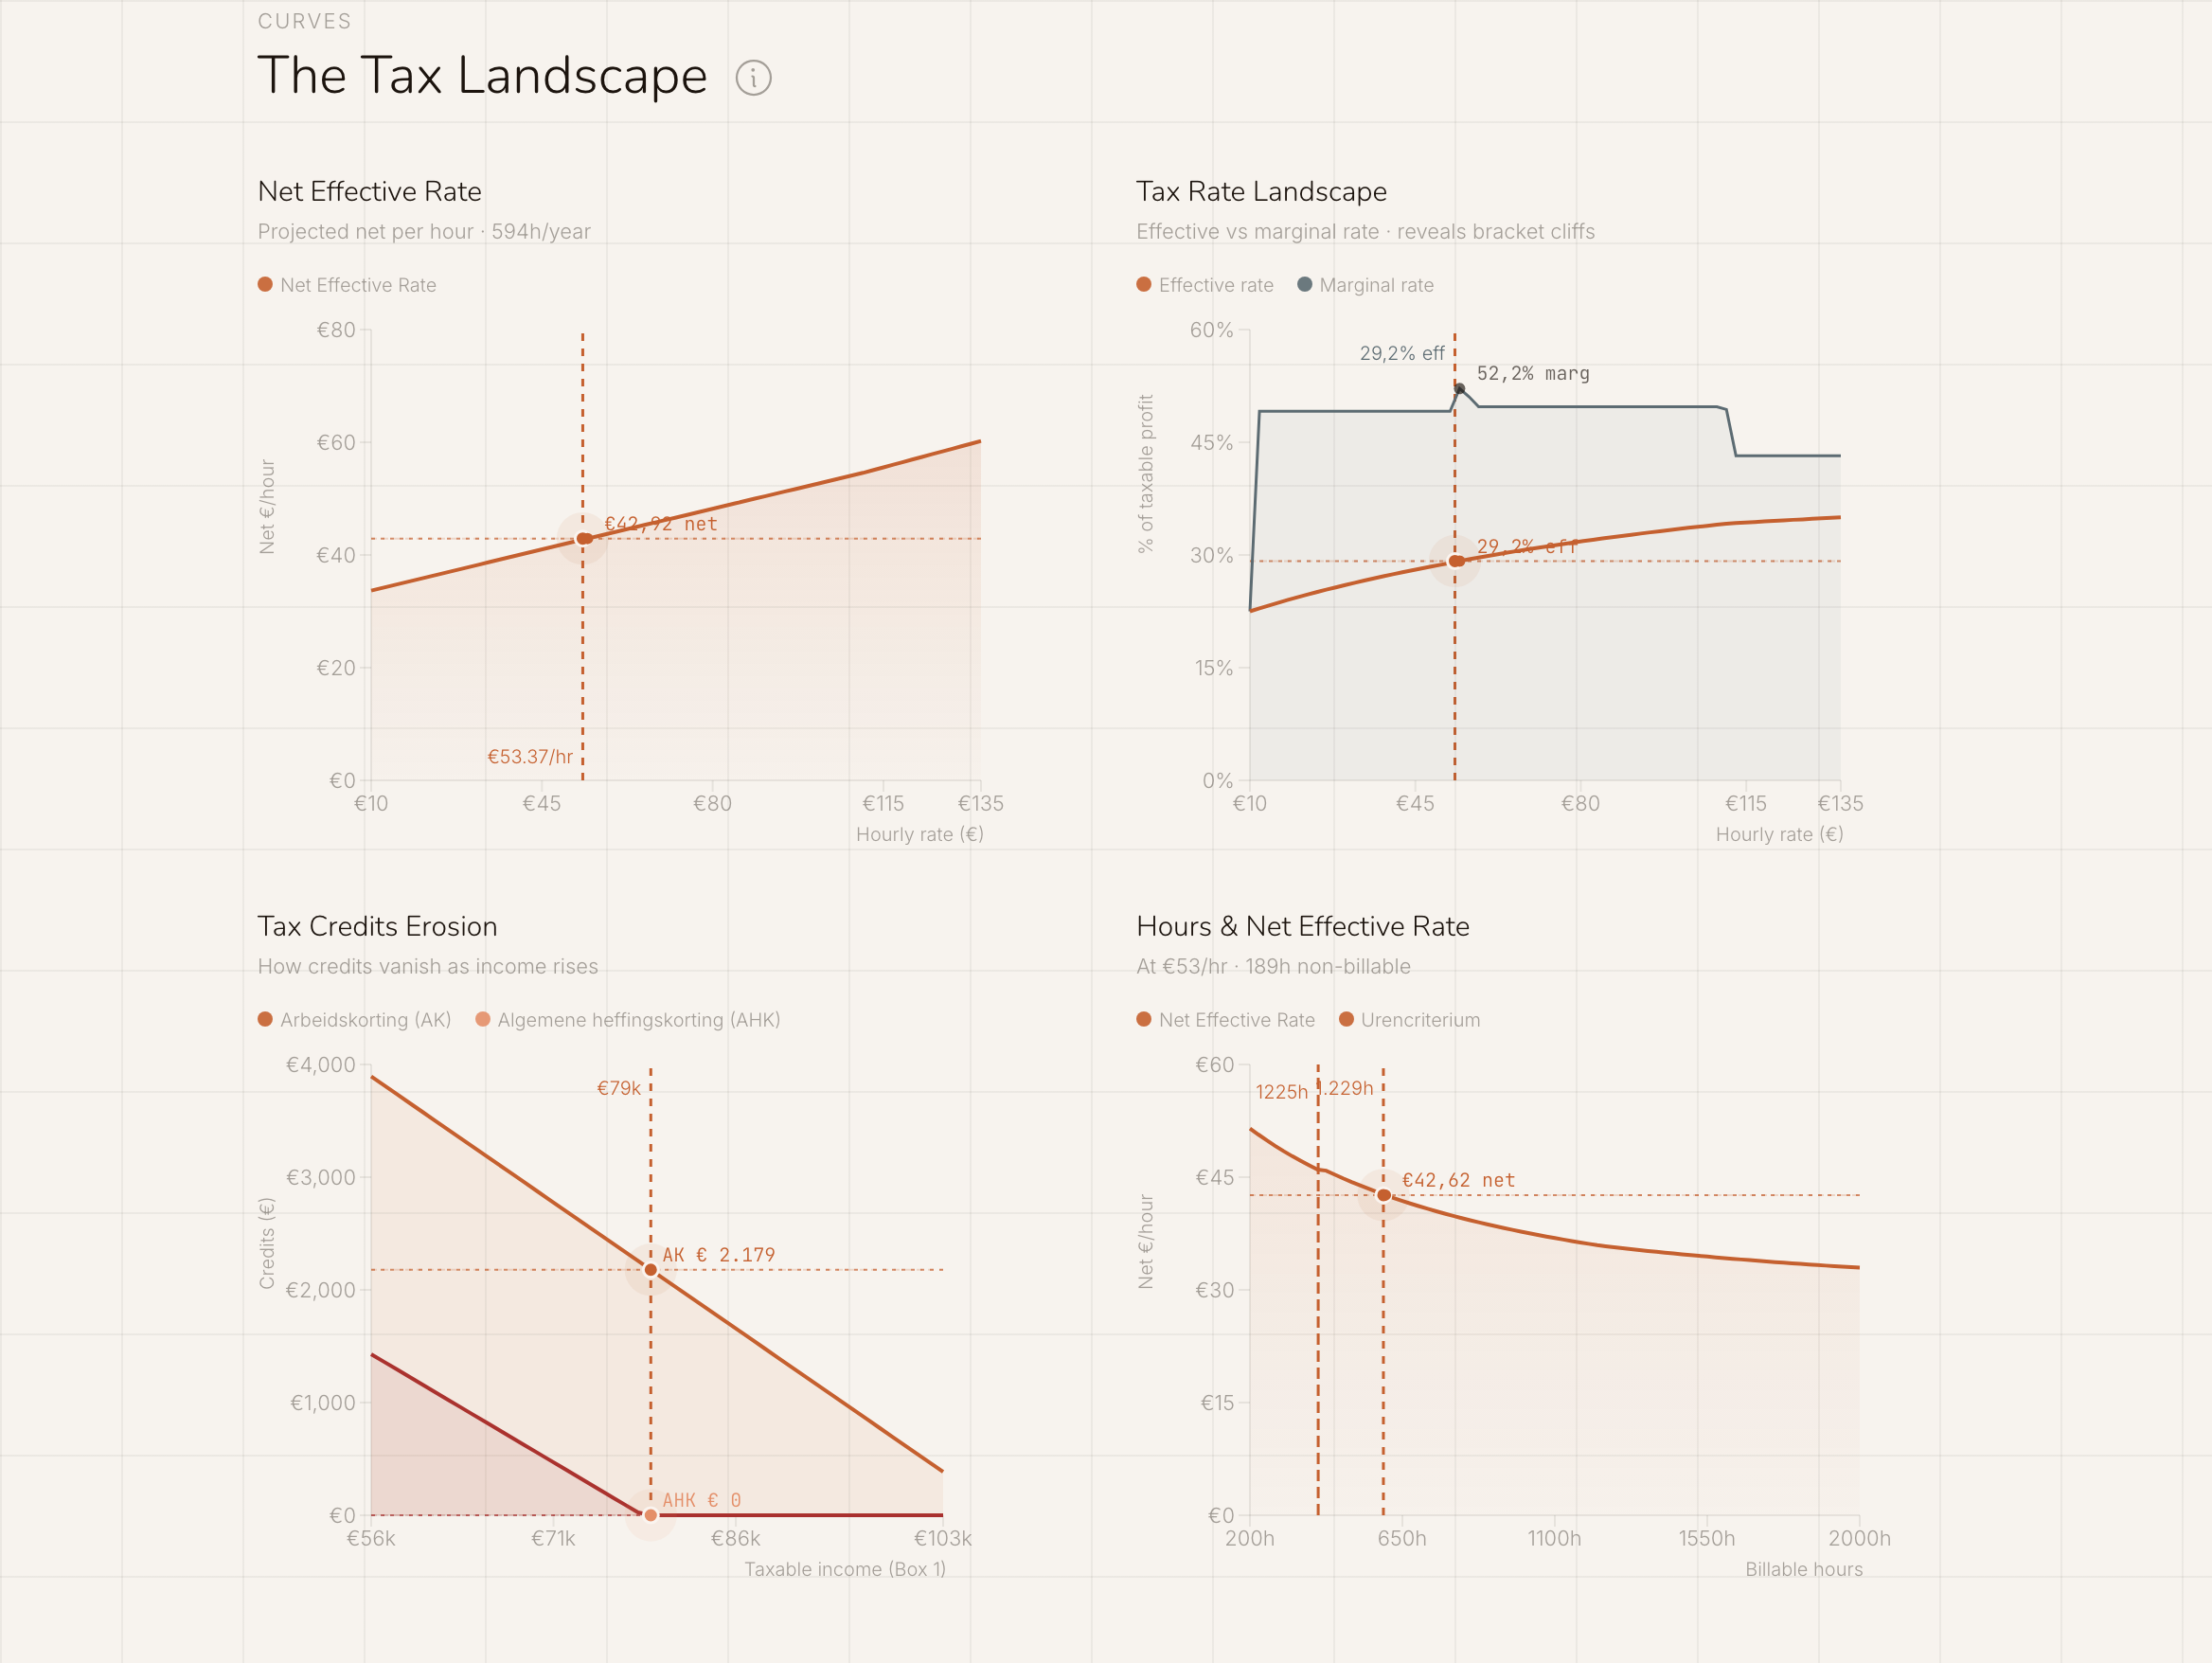
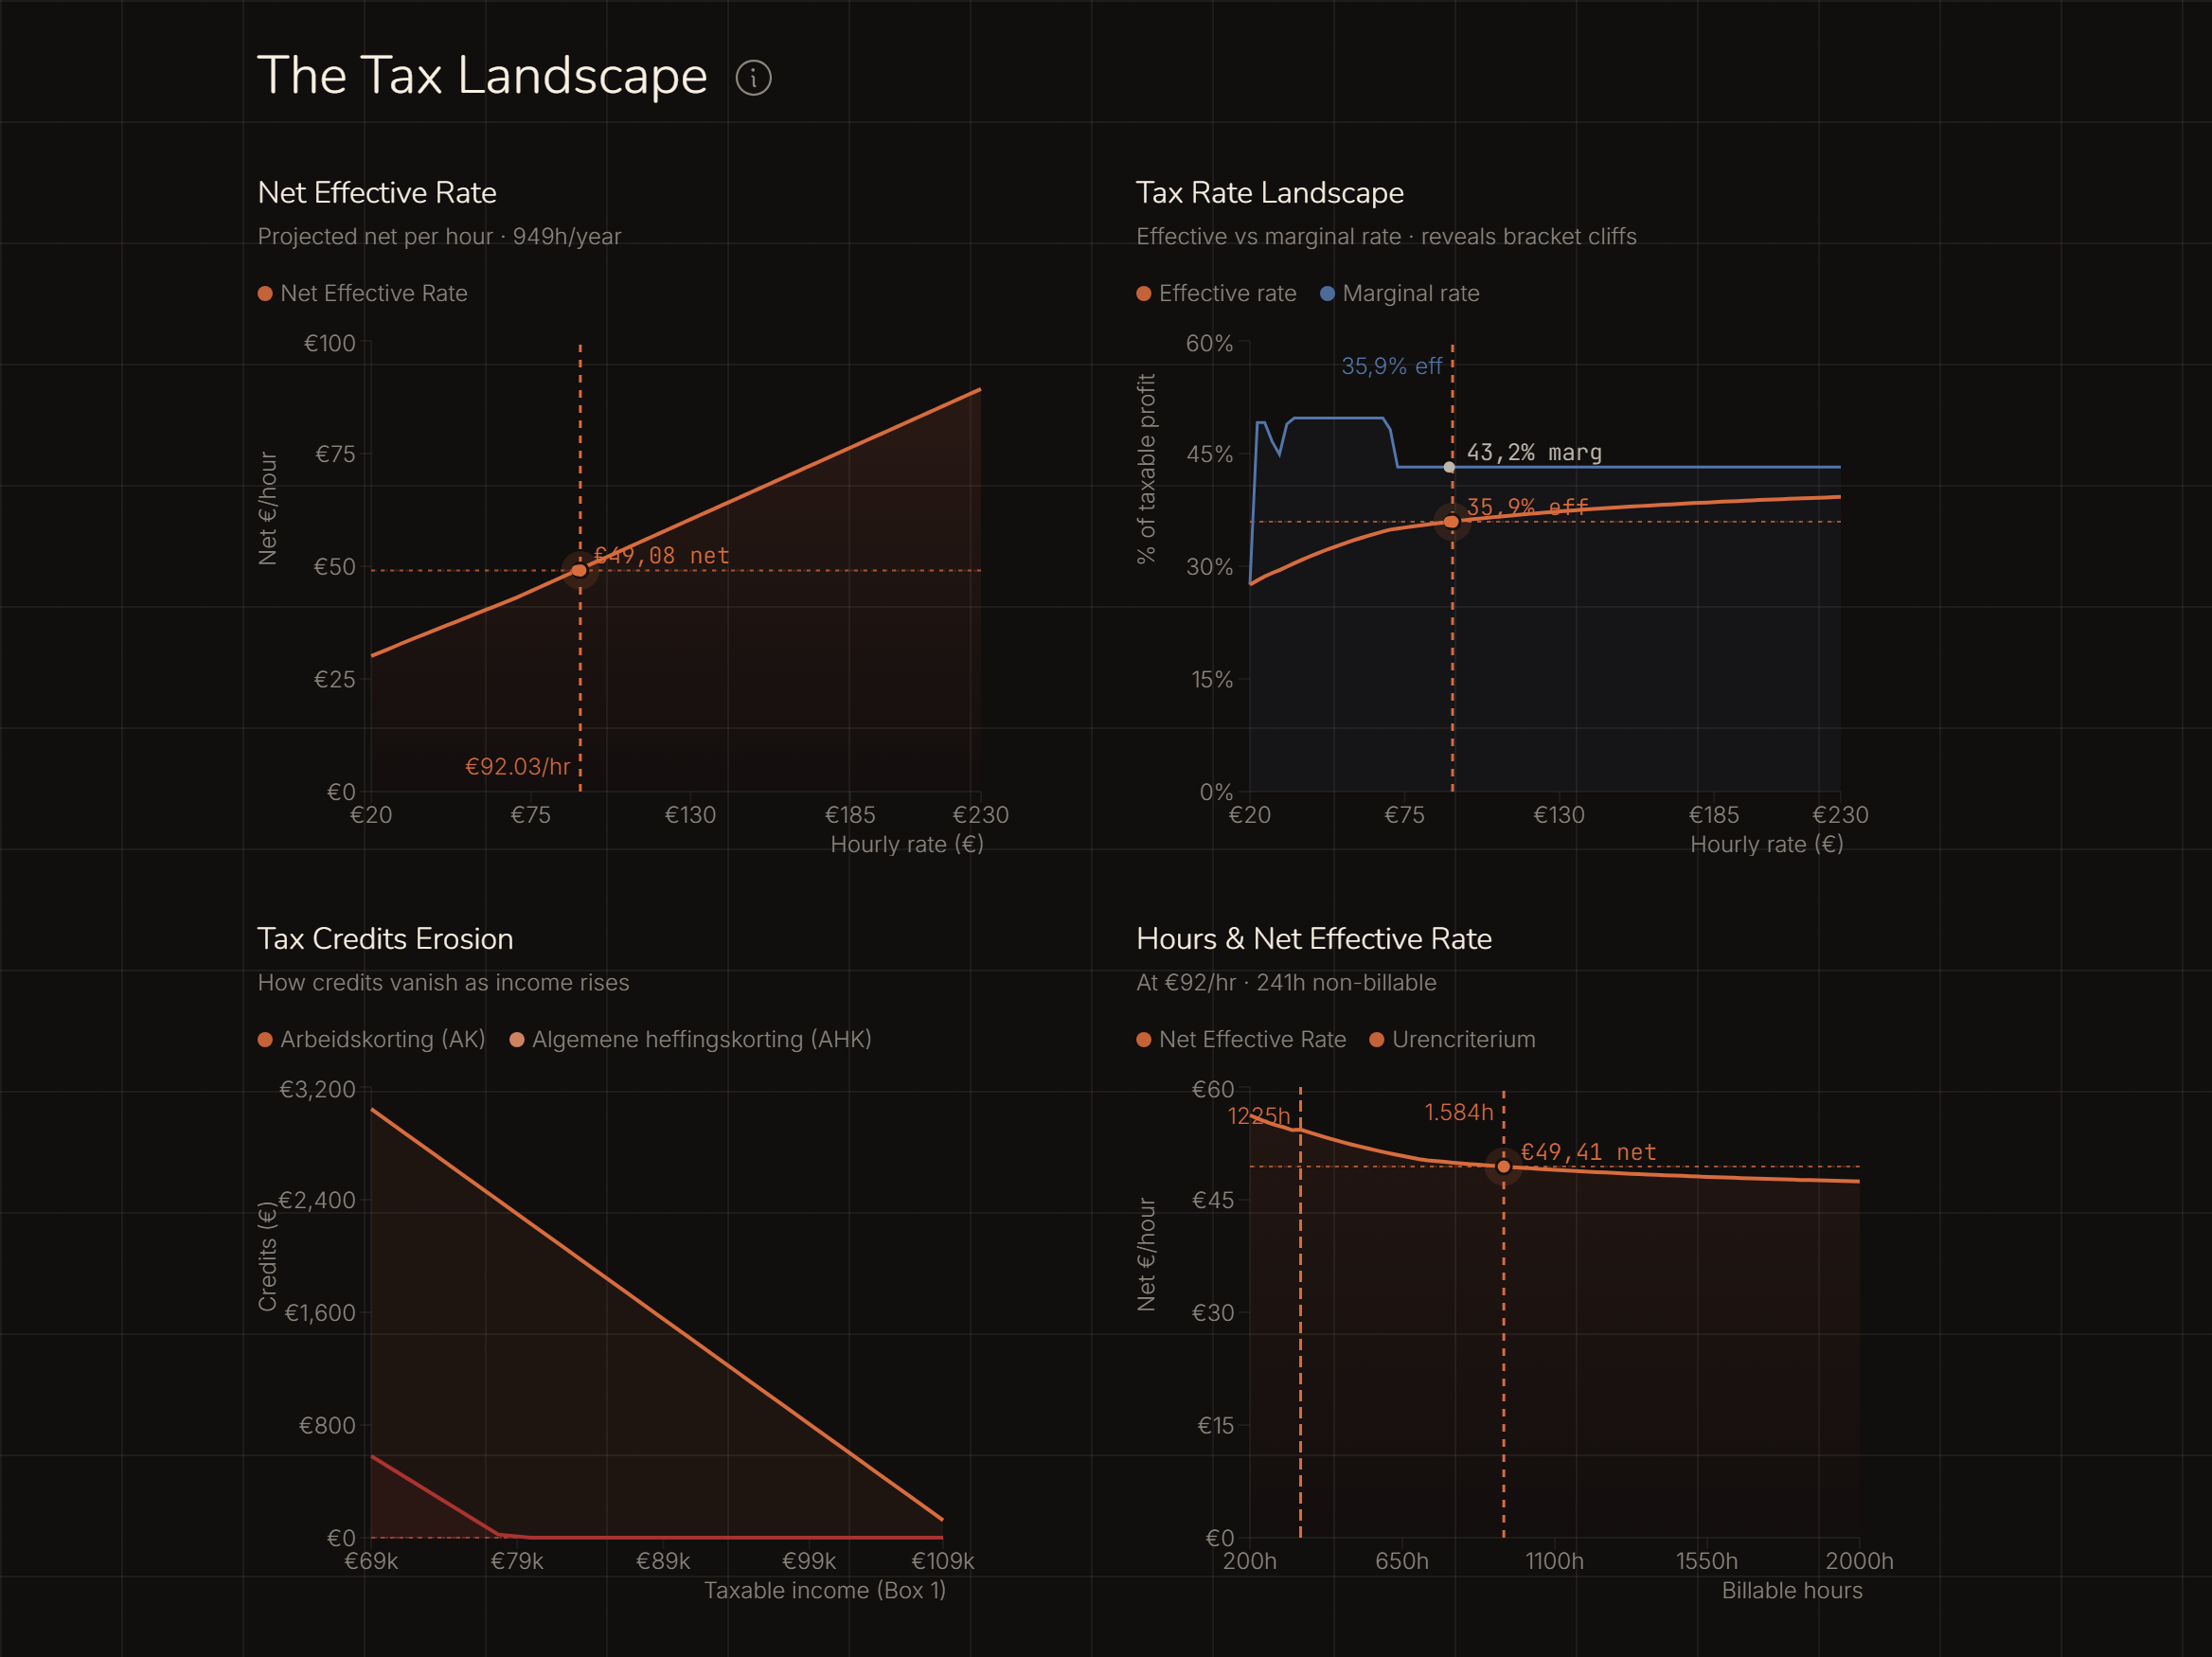
The Dutch tax system isn't linear: tax credits phase out and marginal rates shift as you earn more. The curves show where you stand in that landscape, in four graphs:
- Net effective rate — what you keep net per hour at a given hourly rate.
- Tax-rate landscape — your effective and your marginal rate, visible per tax bracket.
- Build-up and phase-out of tax credits — how the labour credit and general tax credit move with your income.
- Hours & net effective rate — what remains per hour as you work more hours, with the hours-criterion threshold (1,225 hours) marked.
Employment comparison
The last section answers a question many freelancers have: how much would I need to earn in employment to keep the same amount? Peil translates your business profit into a comparable payslip, including holiday pay, pension accrual and the employer costs that normally stay invisible.
The comparison works both ways. With "Freelance as salary" you see which gross salary (and which total employer cost) matches your current income. With "Salary as freelance" you enter a salary offer and see which hourly rate you need as a freelancer to match it.
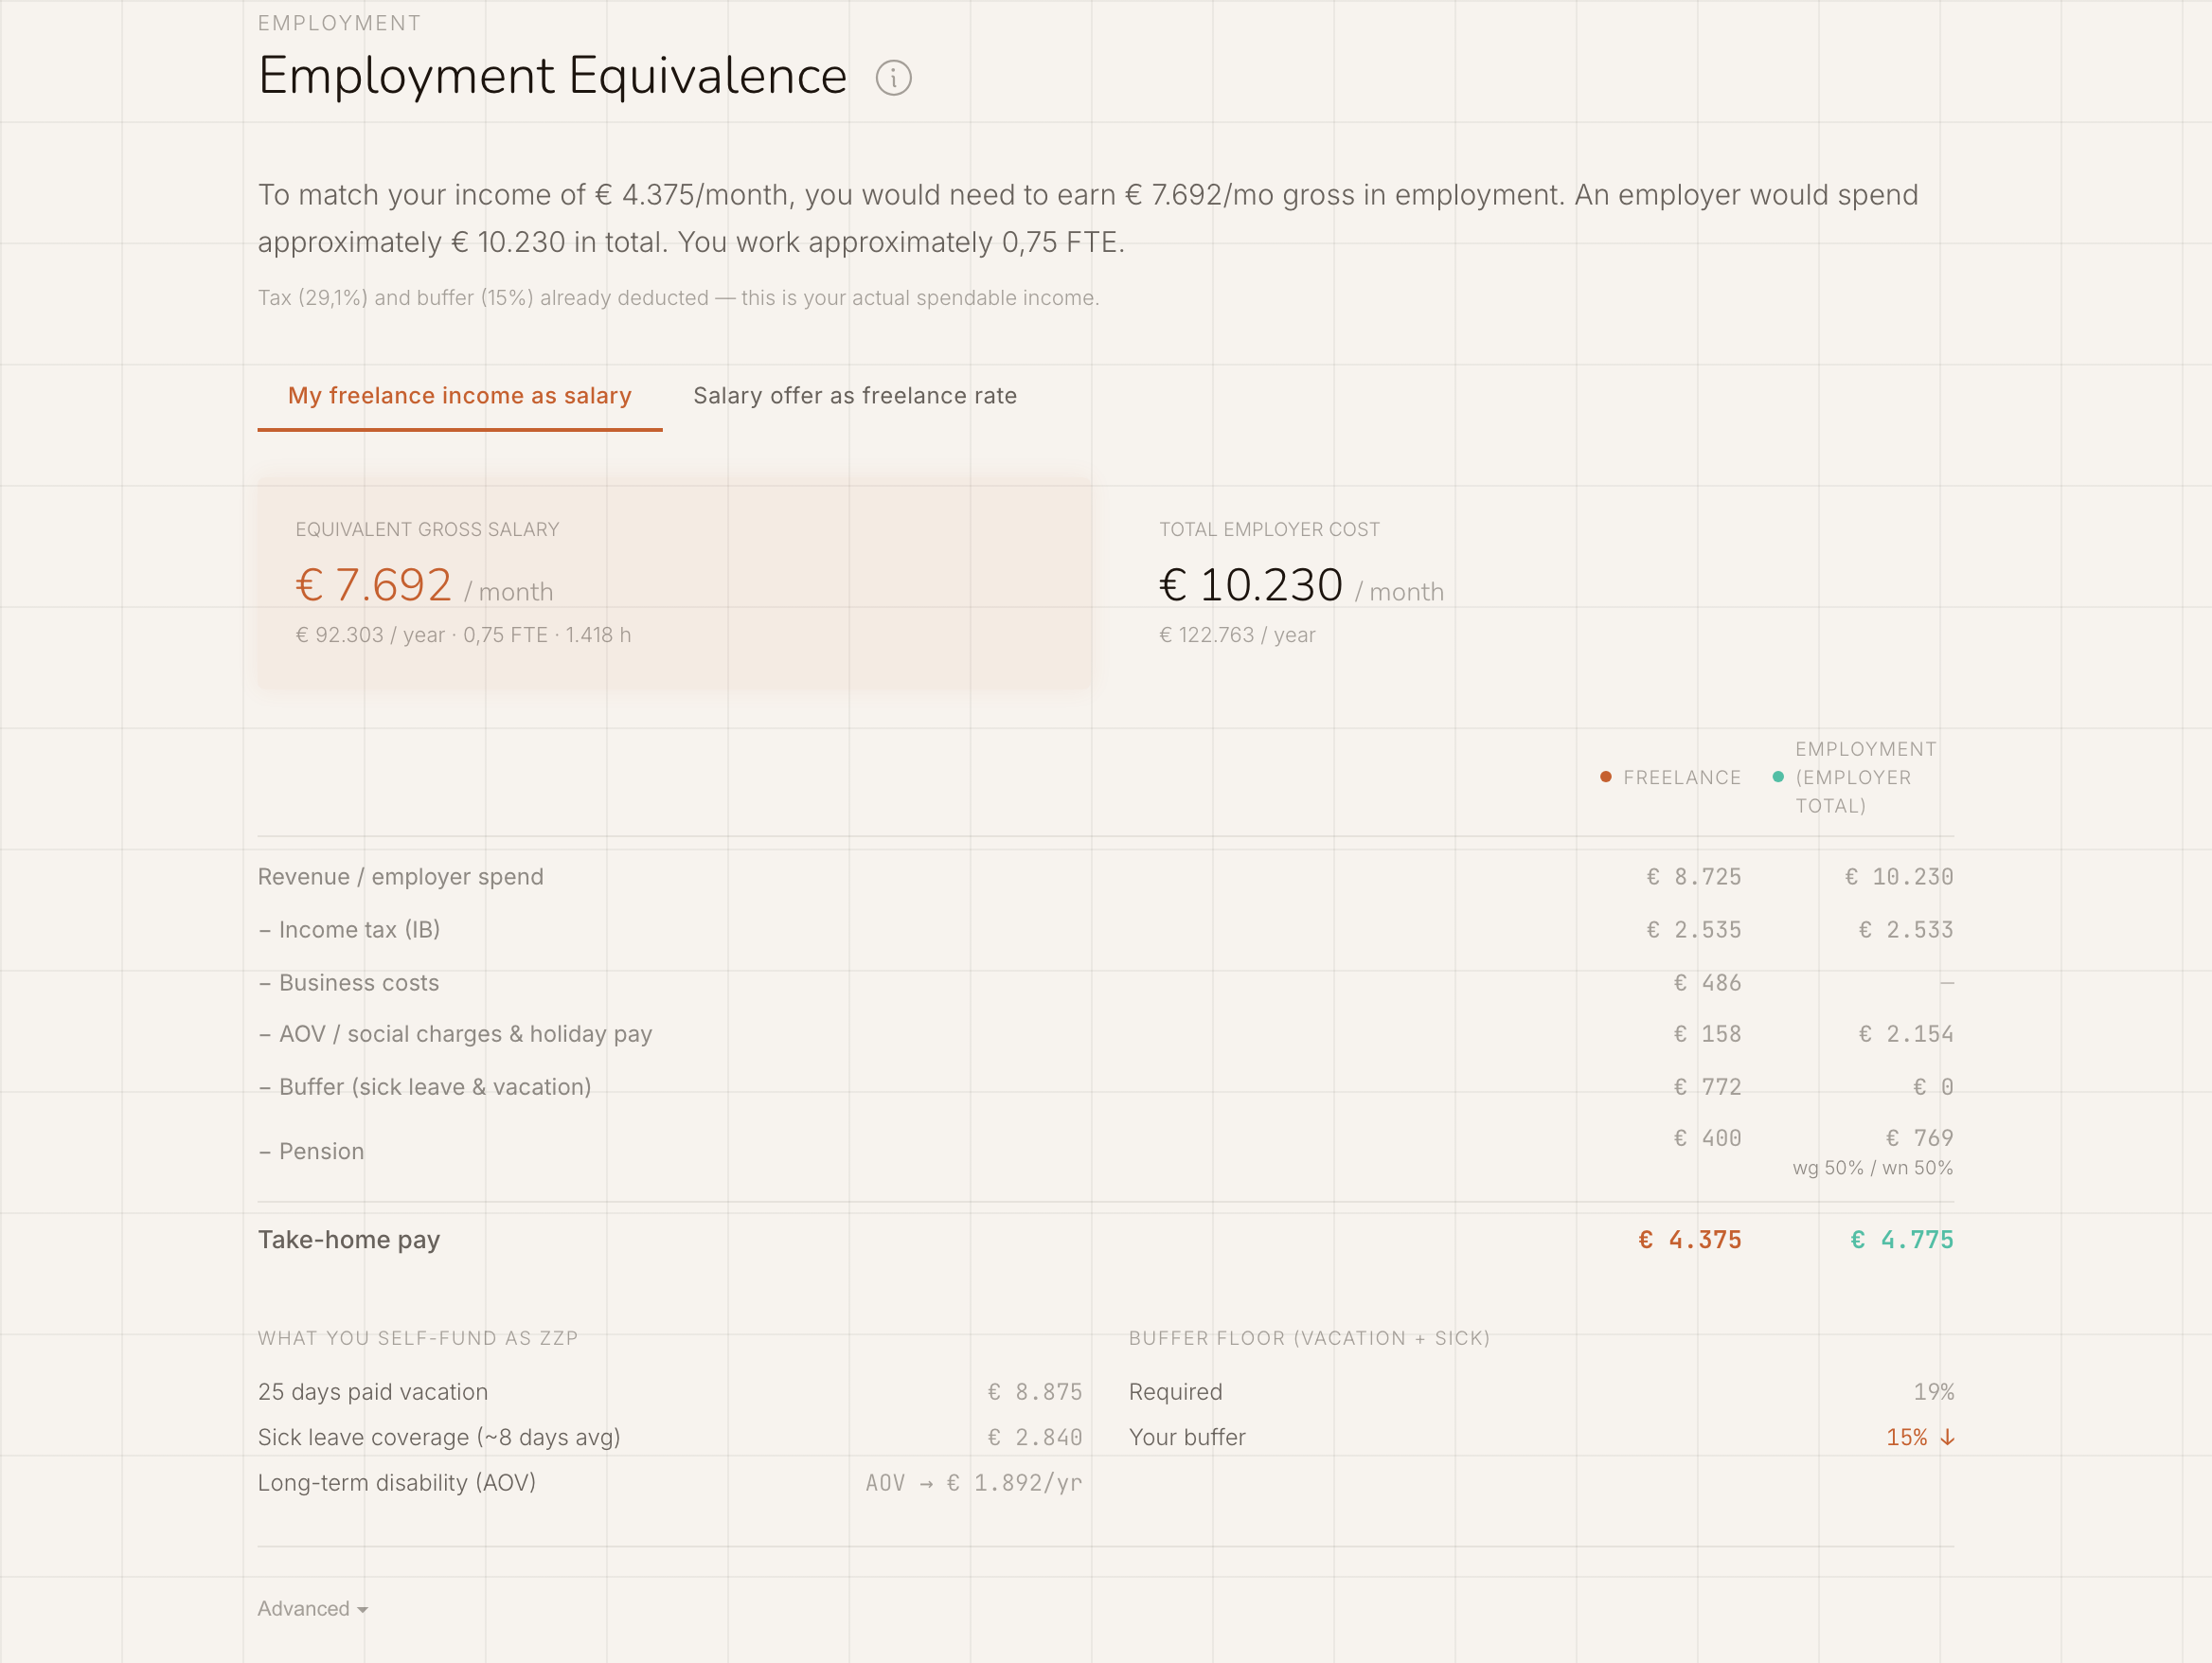
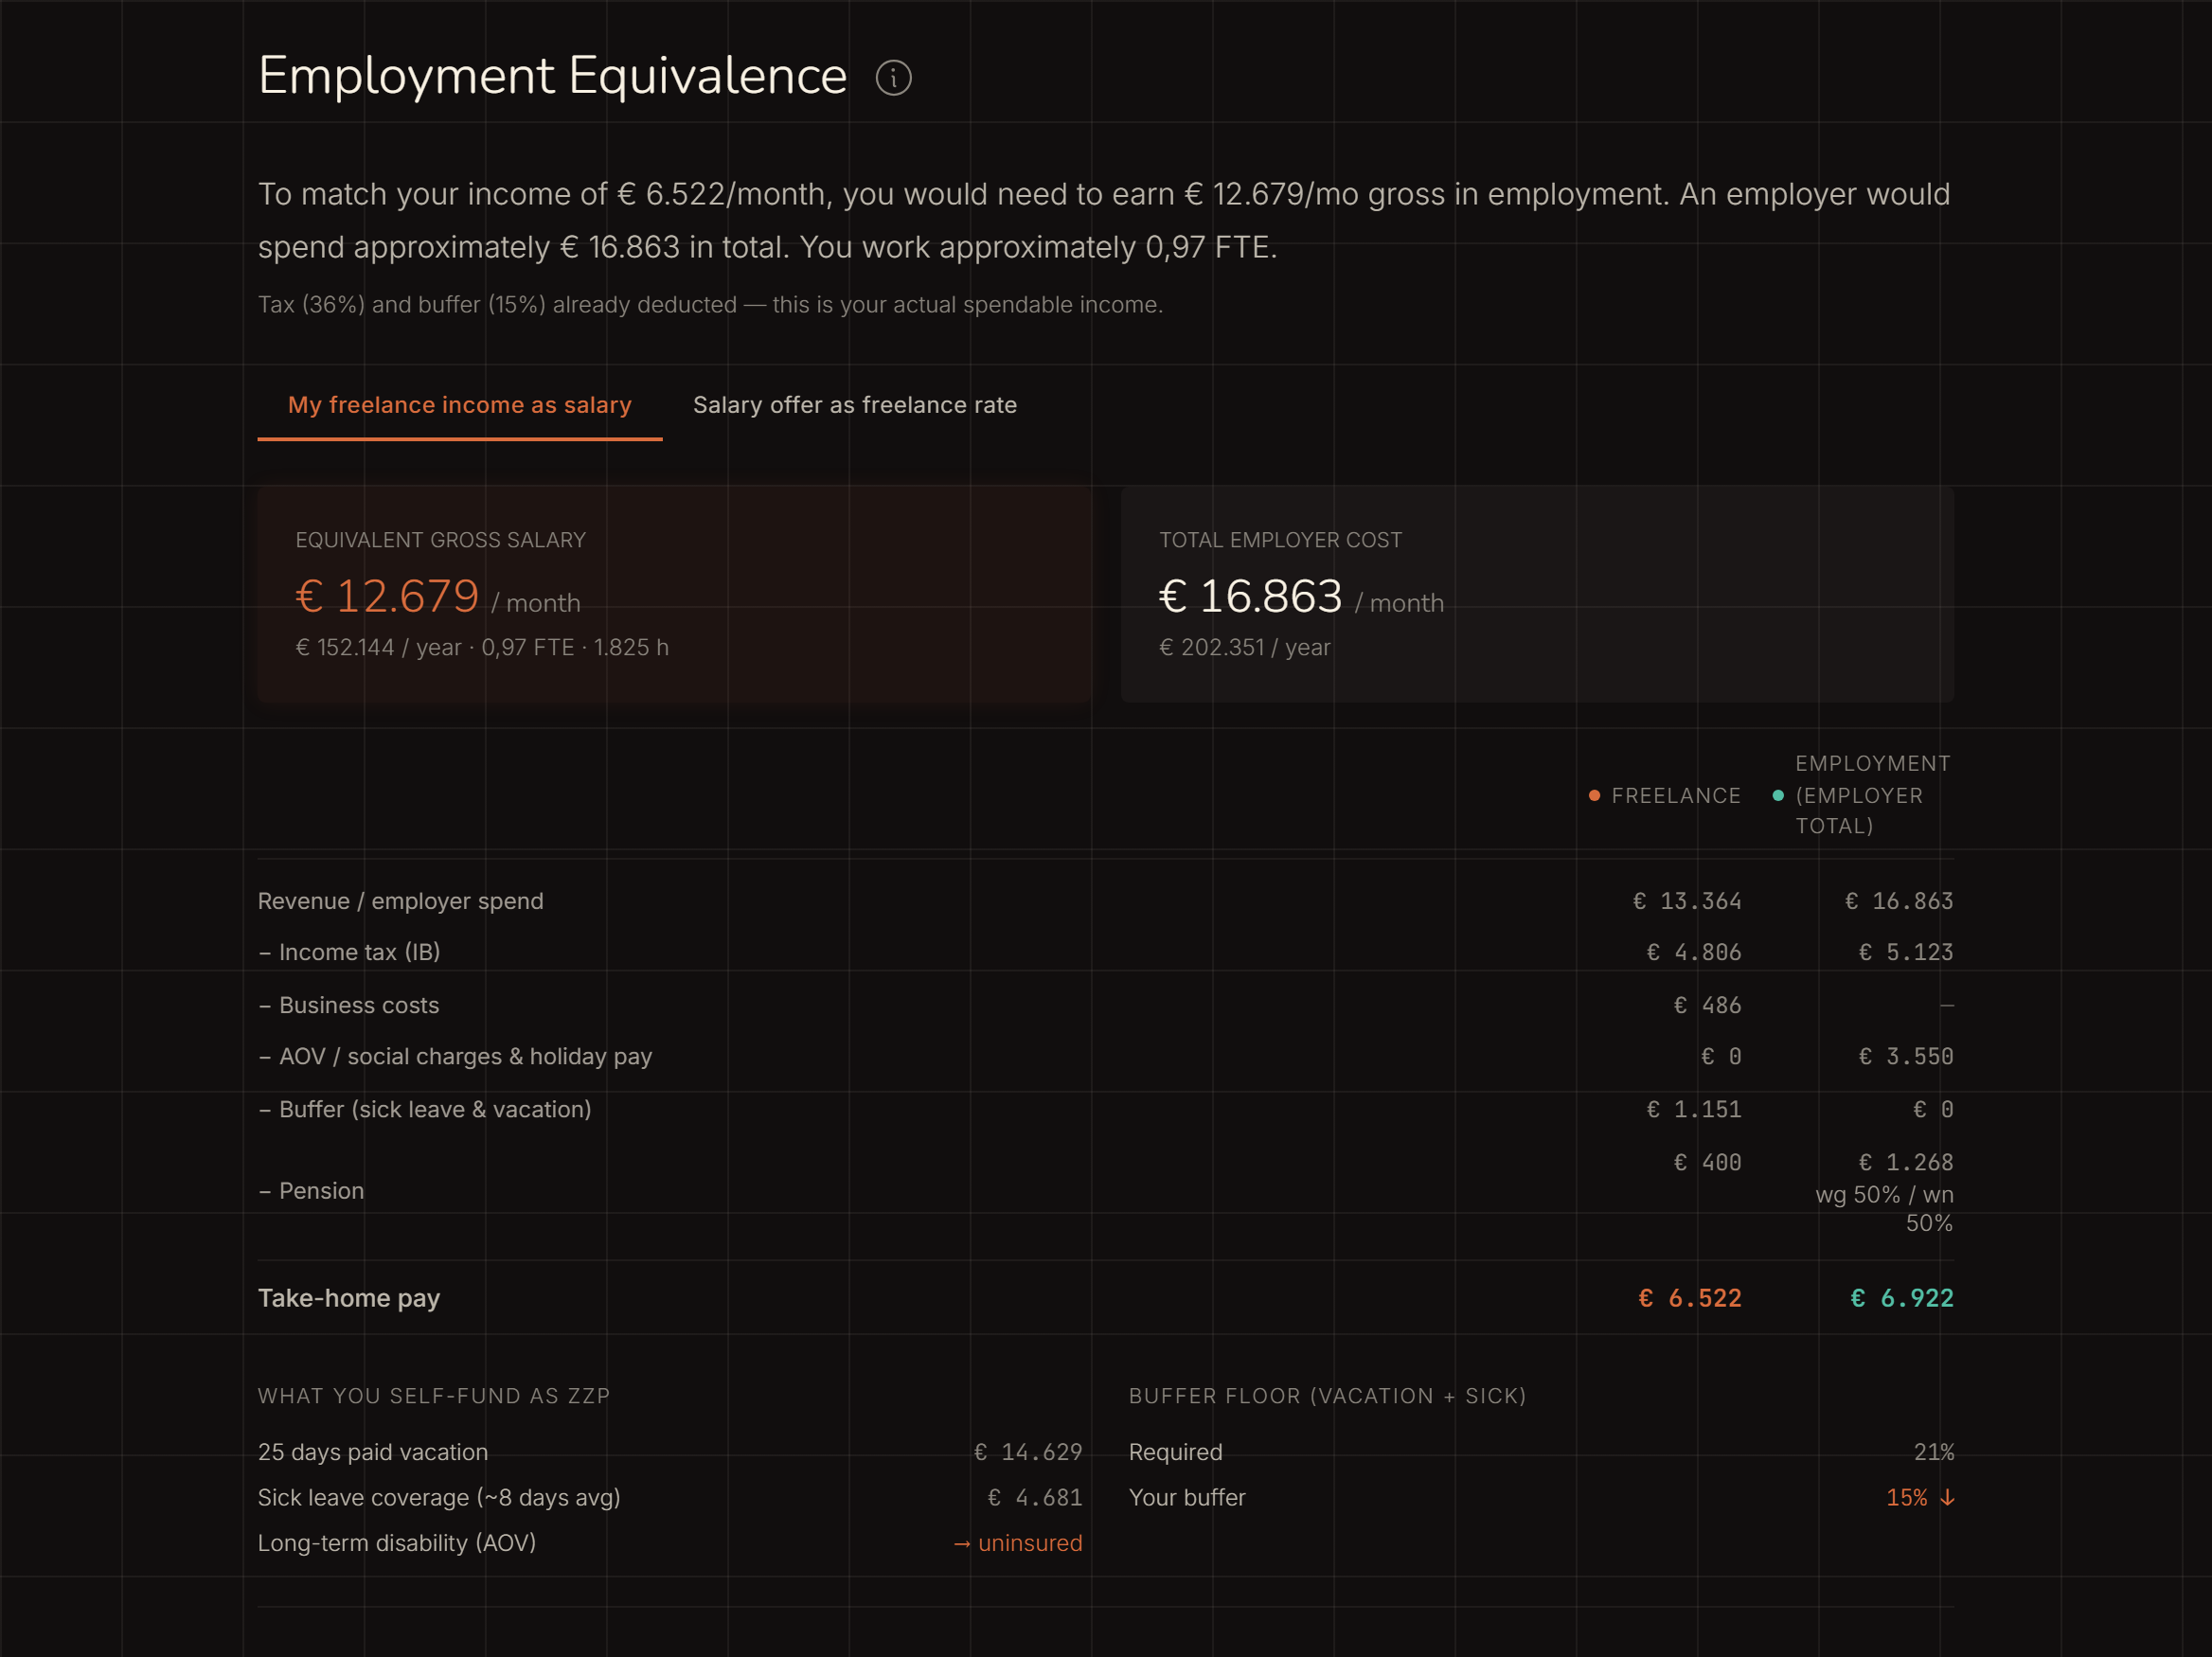
Below the comparison is what you arrange yourself as a freelancer versus what an employer normally covers: paid leave, sick days and disability. That's what makes a bare salary figure truly comparable.
Go to the Financial Lab to explore your own figures.